14 results
Adult education Common Core 7.SP.B.3 resources
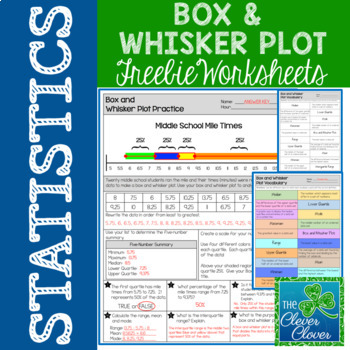
Box and Whisker Plot - FREEBIE
This resource can be used for practice with creating and interpreting box and whisker plots. Students will use twenty mile times in order to calculate the five number summary. Space is provided for students to list the numbers in order from least to greatest. Students are directed to shade and label each quartile of the box and whisker plot. After the plot has been drawn, students can answer six questions pertaining to the data.
Practice with vocabulary is also important. Students can use
Subjects:
Grades:
6th - 9th, Adult Education
Types:
Also included in: Statistics Bundle - Guided Notes, Worksheets & Scavenger Hunts!
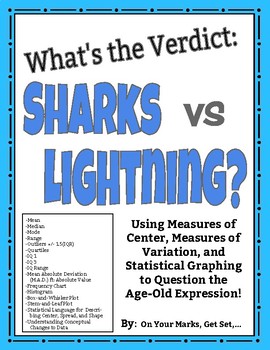
What's the Verdict: Sharks vs. Lightning? Modes of Center, Spread, and More!
Put it to the test! Use the age-old expression: "You are more likely to get struck by lightning than to be bitten by a shark!" to learn and practice Measures of Center, Measures of Spread, Measures of Shape, and Statistical Graphing including:MEANMEDIANMODERANGEOUTLIERS [Using IQR +/- 1.5(IQR)]QUARTILES [lower quartile (IQ-1) and upper quartile (IQ-3)]INTERQUARTILE RANGE (IQR)MEAN ABSOLUTE DEVIATION/ M.A.D. ft. ABSOLUTE VALUESYMMETRY/ASYMMETRY OF DISTRIBUTIONCLUSTERS AND GAPSBELL SHAPED CURVE AN
Subjects:
Grades:
5th - 12th, Higher Education, Adult Education
Types:
Math Activities for the Year!
This is a collection of math activities for the year. These could also be used as homework, math centers, task cards, review for test, etc. These are divided into the following domains:Rational Numbers - 37 activitiesExpressions and Equations - 34 activitiesRatios and Proportional Relationships - 24 activitiesInferences and Data - 20 activitiesGeometry - 36 activitiesProbability - 20 activitiesThe entire pack (with title pages and answer sheets is 348 pages) which can be shown as a power point
Grades:
5th - 9th, Adult Education
Types:
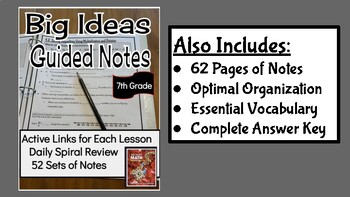
Big Ideas Math Interactive Guided Notes (7th Grade)
This product does not require having the BIG IDEAS text. These notes are to be used with the Modeling Real-Life series that can be found online for free. I created guided notes for my 7th graders. I use these notes to guide my teaching of each lesson. As I teach the new lesson, I encourage my students to help me fill-in the blanks. The clozed notes section encourages math discussions and helps to review and introduce vocabulary. GREAT resource to use as an ACCOMMODATION for IEP's and 504's. GREA
Subjects:
Grades:
7th, Adult Education
Also included in: 7th & 8th Grade Big Ideas Guided Notes
6 Editable Bar Graph Templates 2.0
Finally a simple and professional graph space that students can fill out without any design issues getting in the way. This file contains 6 ready-to-use graph options. Print them and have students fill them with pencil and ruler, or distribute them over computer and let them practice entering the data. Get a project perfect finish every time. Maybe you just want to fill it out live on a projector? The possibilities are endless! It's okay to say you love these bar graphs. So do we.Contains:- 2 bl
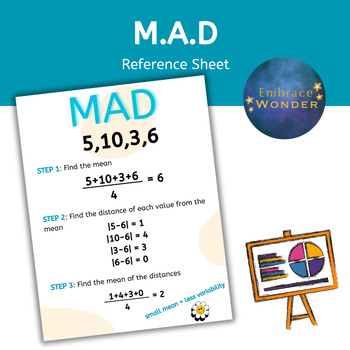
M.A.D Reference Sheet | Mean Absolute Deviation Graphic Organizer | Statistics
Teaching M.A.D? Is your classroom filled with the joy of students analyzing data and crunching numbers? Add this Mean Absolute Deviation Reference Sheet to your lesson collection. Also great for students in an IEP that require a graphic organizer in their lessons. Easy to print and project!What's included:1 PDF• Images are high resolution PDFs, perfect for printing and web use.---------------------------------------------------------------------------------------------------------------Let's Con
Subjects:
Grades:
5th - 12th, Higher Education, Adult Education, Staff
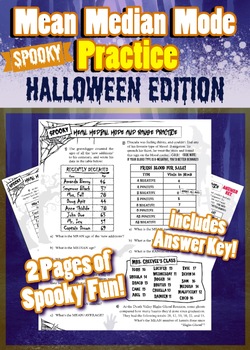
Halloween Mean Median Mode Range Practice - Spooky and Fun Math Handout
Spooky and FUN Mean Median Mode Range Practice - Halloween Printable ActivityEven your most ghoulish students will love this handout! It's full of hilarious scenarios and monster names, and includes lots of spooky fonts and icons. Your students will be so entertained by this printable, that they'll forget they're improving their math skills while using it.Since each problem on the handout is a multi-part problem, this handout features over 25 chances for students to improve their statistical ana
Subjects:
Grades:
4th - 9th, Adult Education
Types:
Math Notebook
My students call this their "Math Bible". It has a one page of notes for each lesson of Pre-Algebra.Skills in here are used in 5th-12th grade. & definitely beneficial for homeschool use. I have students either glue them into their own notebook or I will hole punch and have them put into a folder/binder.Other teachers have asked for this notebook to refresh their memory.
Subjects:
Grades:
5th - 12th, Higher Education, Adult Education, Staff
Passion-Driven Statistics E-book (Introductory/AP Statistics Course Textbook)
Passion-Driven Statistics is an NSF-funded, multidisciplinary, project-based curriculum that supports students in conducting data-driven research, asking original questions, and communicating methods and results using the language of statistics. The curriculum supports students to work with existing data covering psychology, health, earth science, government, business, education, biology, ecology and more. From existing data, students are able to pose questions of personal interest and then use
Subjects:
Grades:
6th - 12th, Higher Education, Adult Education
Types:
SPSS software Secondary Data Analysis Workshop (Introductory/AP Statistics)
This handout is intended for those interested in teaching/learning basic introductory statistics concepts to analyze real data. Students will learn how to tell a story using secondary data analysis. The handout is for SPSS and the US Longitudinal Study of Adolescent Health data set. For handouts on the data set code book and raw data file, a PowerPoint to accompany the handout, or questions please email kristin.flaming@gmail.com or ldierker@wesleyan.edu.This handout was developed as a condensed
Subjects:
Grades:
6th - 12th, Higher Education, Adult Education
Types:
Translation Code
As part of our NSF-funded passion-driven statistics project, we have just started to share more widely our “translation code” aimed at supporting folks in learning code-based software and in moving more easily between them. The pdf includes all of the basic syntax for managing, displaying and analyzing data, translated across SAS, R, Python, Stata and SPSS. http://bit.ly/PDSTranslationCode.For more information about our warm and welcoming data-driven curriculum, check out https://passiondrivenst
Grades:
6th - 12th, Higher Education, Adult Education
Types:
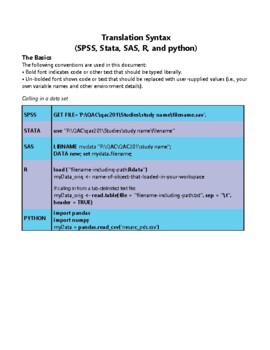
STATA software Secondary Data Analysis
This handout is intended for those interested in teaching/learning basic introductory statistics concepts to analyze real data. Students will learn how to tell a story using secondary data analysis. The handout is for STATA software and the US Longitudinal Study of Adolescent Health data set. For handouts on setting up an account, the data set code book and raw data file, a PowerPoint to accompany the handout, or questions please email kristin.flaming@gmail.com or ldierker@wesleyan.edu.This
Grades:
6th - 12th, Higher Education, Adult Education
Types:
SAS software Secondary Data Analysis Workshop (Introductory/AP Statistics)
This handout is intended for those interested in teaching/learning basic introductory statistics concepts to analyze real data. Students will learn how to tell a story using secondary data analysis. The handout is for SAS (email for R, SPSS, Stata, & Python), a free cloud based system and the US Longitudinal Study of Adolescent Health data set. For handouts on setting up a free SAS account, the data set code book and raw data file, a PowerPoint to accompany the handout, or questions please e
Grades:
6th - 12th, Higher Education, Adult Education
Types:
R software Secondary Data Analysis Workshop (Introductory/AP Statistics)
This handout is intended for those interested in teaching/learning basic introductory statistics concepts to analyze real data. Students will learn how to tell a story using secondary data analysis. The handout is for R or R Studio, a free cloud based system and the US Longitudinal Study of Adolescent Health data set. For handouts on setting up a free R account, the data set code book and raw data file, a PowerPoint to accompany the handout, or questions please email kristin.flaming@gmail.com or
Subjects:
Grades:
6th - 12th, Higher Education, Adult Education
Types:
Showing 1-14 of 14 results

