21 results
5th grade Common Core 7.SP.A.2 microsofts
180 Middle School Math Warm-Ups: Full Year of Daily Bell Ringers & Starters
First five minutes? Planned! With this set of daily bellringers, you'll engage your students and get them thinking! Made for 5th, 6th, 7th, or 8th grade math, these open-ended and challenging starters will have your students ready for your lesson. This resource is truly print-and-go, no-prep for the whole school year. Either print the provided student answer sheet for a weekly grade or have students respond on a dry-erase board or paper. Help your students make connections by using this resourc
Subjects:
Grades:
5th - 8th
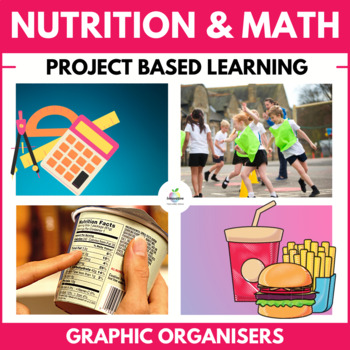
Food & Nutrition Labels | Healthy Eating Math Unit | Statistics & Data | PBL
Teach your students the importance of HEALTHY EATING with this engaging NUTRITION LABEL reading unit. Students will learn to evaluate nutrition labels and make informed choices about DIET and the foods they consume.This NO-PREP, MULTIDISCIPLINARY MATH UNIT will keep them engaged as they learn about FAST FOOD, what they are putting in their mouth, and the amount of activity required to burn it off. AN ESSENTIAL LIFE SKILL.Most students love ♨️FAST FOOD♨️; maybe it's a guilty pleasure, but do we
Subjects:
Grades:
4th - 9th
Also included in: Innovative Substitute Teaching Bundle | No Prep Sub Plans
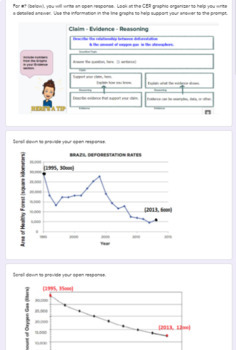
Data Analysis: Deforestation & Oxygen Gas Human Impact CER Open Response
Students identify the pattern between deforestation (decreasing area of forest) & decreasing amount of oxygen gas in the air. Using line graphs, students are guided in describing the relationship between two data sets to describe the negative human impact on ecosystems. A claim - evidence- reasoning (CER) graphic organizer is provided to guide students' writing. Encouraged to incorporate evidence, students are also prompted to think about the importance of each element of the CER writing too
FREEBIE: 180 Middle School Math Warm-Ups: No-Prep Daily Bellringers & Starters
First five minutes? Planned! With this set of daily bellringers, you'll engage your students and get them thinking!Made for 5th, 6th, 7th, or 8th grade math, these interesting and challenging starters will have your students ready for your lesson.With a pre-made student response sheet, this resource is truly print-and-go, no-prep for the whole school year.Help your students make connections by using this resource at the beginning of class each day!Want all 180 No-Prep 5-Minute Math Warm-Ups? Cli
Subjects:
Grades:
5th - 8th
Math Activities for the Year!
This is a collection of math activities for the year. These could also be used as homework, math centers, task cards, review for test, etc. These are divided into the following domains:Rational Numbers - 37 activitiesExpressions and Equations - 34 activitiesRatios and Proportional Relationships - 24 activitiesInferences and Data - 20 activitiesGeometry - 36 activitiesProbability - 20 activitiesThe entire pack (with title pages and answer sheets is 348 pages) which can be shown as a power point
Grades:
5th - 9th, Adult Education
Types:
Measures of Central Tendency Guided Notes
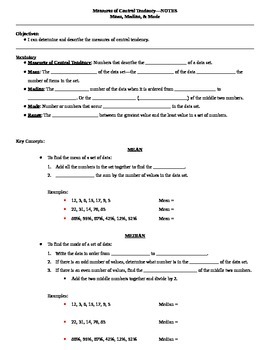
These are guided notes for a lesson on measures of central tendency including mean, median, mode, and range. There are several examples in the notes and the same data sets are used to show each measure of central tendency.I have also included a teacher key to show you what to fill in the blanks as your students follow along.To use these notes, I simply projected them onto my whiteboard, gave the students their blank copies, and had them follow along and write what I wrote. This works great when
Subjects:
Grades:
5th - 12th
CCSS:
Statistics & Data Math Unit | Project Based Learning | Mean, Median, Mode, Range
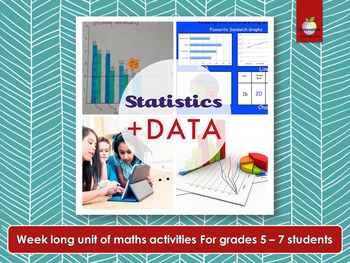
Make math relevant and engaging for your students with the elementary/primary STATISTICS and DATA PROJECT. This NO PREP, this hands-on PROJECT-BASED LEARNING, will keep your class busy learning about MEAN, MEDIAN, MODE and RANGE for a whole week.COVERINGHow to ask and survey an “essential question.”Data collection methodsDrawing mathematical conclusions from dataPresenting data in graphs and tablesPresenting data and conclusions to peersThis insightful project makes a great, lively introduction
Subjects:
Grades:
5th - 7th
BOX PLOTS (Box-and-Whisker Plots) PowerPoint Lesson AND Guided Practice DIGITAL
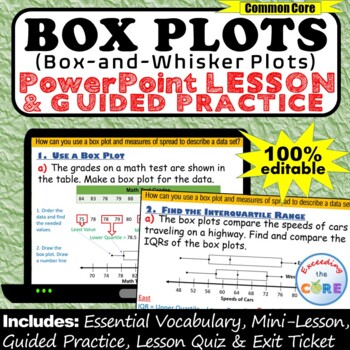
Great for online learning and distance learning!Get your students successfully creating and using BOX PLOTS (Box-and-Whisker Plots) with this PowerPoint Presentation. This lesson begins with a focused mini-lesson and guided practice questions. It concludes with a lesson quiz and exit ticket to assess student understanding. All of the answers are included. This PowerPoint presentation is 100% editable, therefore you can modify any slide as needed.What is Included:_ Mini-Lesson with Guided Practi
Subjects:
Grades:
5th - 7th
6 Editable Bar Graph Templates 2.0
Finally a simple and professional graph space that students can fill out without any design issues getting in the way. This file contains 6 ready-to-use graph options. Print them and have students fill them with pencil and ruler, or distribute them over computer and let them practice entering the data. Get a project perfect finish every time. Maybe you just want to fill it out live on a projector? The possibilities are endless! It's okay to say you love these bar graphs. So do we.Contains:- 2 bl
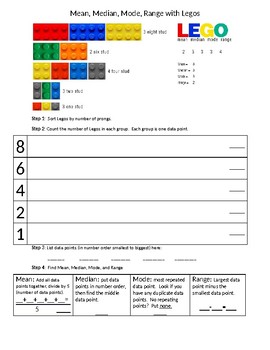
Mean, Median, Mode, and Range Using Legos
Students use Legos to learn how to find the Mean, Median, Mode, and Range in this easy and fun activity.
Requires Lego pieces
Uses resources from Erin Bittman (with permission). Go to her website at http://eisforexplore.blogspot.com/2013/04/lego-mmmr.html for more ideas!
Subjects:
Grades:
5th - 8th
Types:

All of the Common Core Math Standards Checklists
This is a bundle of checklists for Math Common Core Standards for all of the grades (K-12) on an excel spreadsheet with 5 columns for data input. These standards are organized in their own sub-domains to coordinate lessons. Please see my free file for an example.
Subjects:
Grades:
K - 12th
Types:
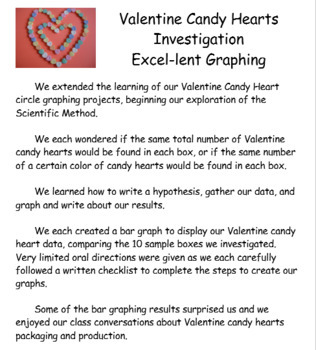
Excel Graphing Valentine Candy Hearts Investigation
#welovecandyheartsThis integrated Math/ Science/ Technology project is a great way to make statistics and probability real, relevant, fun, and delicious!Students will create bar graphs using Excel to display Valentine candy hearts data, as students consider packaging and production of small Valentine candy heart individual boxes. Project file includes sample bulletin board display poster, project directions in individual student checklist form, and rubric to grade the finished graph.Project file
Grades:
5th - 7th
Types:
NGSS:
3-5-ETS1-2
, MS-ETS1-3
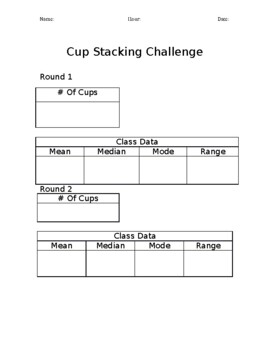
Mean, Median, Mode, and Range Cup Stacking Challenge
Are you teaching mean, median, mode, and range? Get your kids moving and LOVING MATH!Provided is a worksheet with empty boxes.Instructions:You will need to purchase plastic cups (solo) or any brand. Pass out cups to groups. Give them 30 seconds to stack as many as they can for round one! Take the total cups from each group, and write the amounts on the board. Have students calculate the class average on total cups stacked. Repeat this again with 20 seconds. Alter this to fit your students needs!
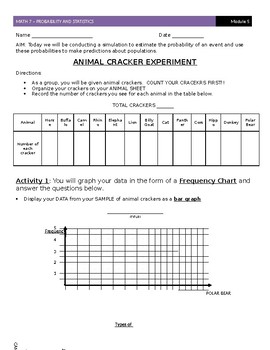
PBL - 7th Grade Probability and Statistics - Animal Cracker Probability
In this activity students will be able to work with probability concepts (simple and compound) while enjoying a snack. For this lesson, you should purchase a package of animal crackers to be handed out to students in bags of 20+ crackers. Students won't even realize that they are doing math!Have Fun and Enjoy!
Subjects:
Grades:
5th - 10th
Types:
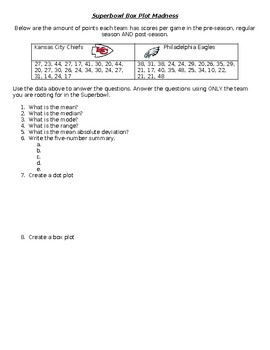
Super Bowl Madness - Statistics
This resource provides you with the total amount of points the Kansas City Chiefs scores this season and the total amount of points the Philadelphia Eagles scores this season. The students must find the mean, median, mode, range, MAD, create a dot plot and create a box plot.
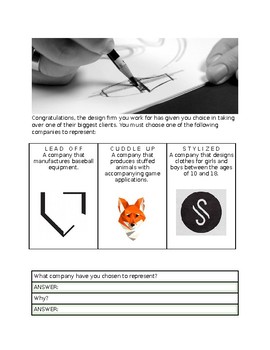
Product Design Math Project
Let your students delve into the real world application of percents, statistics, and graphing.
They will choose one of three company focuses that need a new product. Students will create questions to survey classmates or schoolmates in order to guide their design.
They will categorize that data and create various graphs, percentage statements, and a presentation.
All of these steps are followed through the steps of design thinking.
Math - Data Management using Technology
This lesson is a detailed example of how Microsoft Excel can help not only statisticians, but the regular student complete tasks in a way that is functional, efficient and easy to read. It is a fantastic tool that helps the student build an appreciation and awareness of how to communicate properly in math. This lesson will allow students to reflect on the topic of “mean” within Data Management and encourage them to clarify and build on their mathematical arguments.
Lastly, this is a perfect w
Grades:
5th - 9th

Data Discovery
Use this activity at the beginning of the school year in Science class to teach and refine data collection skills, build conversations about data analysis, and graphs vs. tables. Students will use classroom items and collect data from their peers to determine how to graph and organize information they have collected. Scientific method, data analysis, or an icebreaker for science.
Subjects:
Grades:
5th - 9th
Types:
CCSS:
NGSS:
MS-ETS1-4
, 3-5-ETS1-2
, MS-ETS1-3
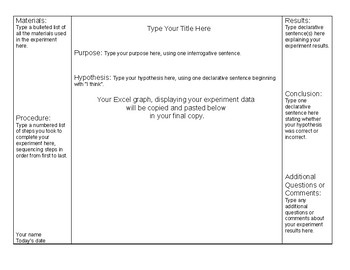
Scientific Method Mini Trifold Board Template
Students can create mini trifold boards, to display any science experiment using the Scientific Method format with this Word document template.
Teachers can save and share this with their students using public file storage available on school servers, Google Drive, etc.
This classroom-tested template was used for a Valentine Candy Heart Investigation project I developed. Student sample work may be viewed on my classroom web site here:
http://www.mrsdingman.com/Vday_Mini_Tri-Fold_Julia.pdf
htt
Subjects:
Grades:
5th - 8th
Types:

Middle School Math Sampling Common Core Project
A sampling project for your middle school students. Have the students investigate various forms of sampling (systematic, voluntary-response, convenience and random). Allows for student creativity and for analysis about survey bias. Rubric including for scoring.
Subjects:
Grades:
5th - 8th
Showing 1-21 of 21 results

