57 results
Elementary statistics bulletin board ideas under $5
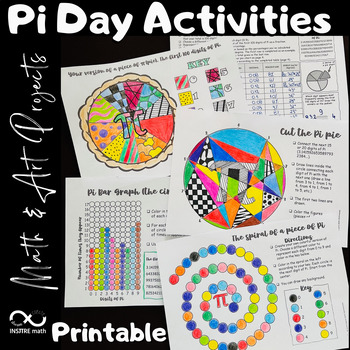
4 Pi Day Math Activities | Math & Art Projects | Coloring Circles | Pie Chart
4 Math & Art Projects to celebrate Pi Day that include circles and Pi exploration! Your students will love these Pi Day activities! Let your students express themselves using these hands-on Math & Art resources during the exploration of Pi.Content:- Your version of a piece of π (pie). The first 100 digits of Pi. Frequency Pie Chart.- Pi Bar Graph - the circular version.- The spiral of a piece of Pi.- Cut the Pi pie.This resource includes:- The editable PowerPoint™ version.- The printable
Subjects:
Grades:
4th - 8th
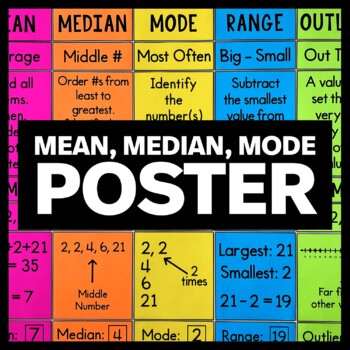
Mean, Median, Mode Poster - Measures of Central Tendency - Math Classroom Décor
Do you need a little help teaching measures of central tendency to your math class? Are you looking for a mean, median, and mode bulletin board display? This poster will look GREAT on your word wall and will help your upper elementary or middle school math class remember this important concept. Two different versions of the poster are included along with several alternate panels for mean, median, mode, and range. Extra panels for "outlier" are not included.The first version of the poster has
Subjects:
Grades:
5th - 8th

How Much is Your Name Worth? Find the Mean, Median Mode of Your Name!
Looking for an engaging way to teach and review mean, median, mode and range? This activity is not only fun and challenging BUT it is PERFECT for bulletin boards.
Included in this set:
-Slides 3-6 are a review or teaching tool to reinforce how to find solve for each: Mean, Median, Mode and Range.
* (Brain Pop has a great video for this!)
-Slide 7 is the key for finding out the value of their first and last name
-Slide 8 is where they figure out and record how much their name is worth
- Sli
Subjects:
Grades:
3rd - 5th
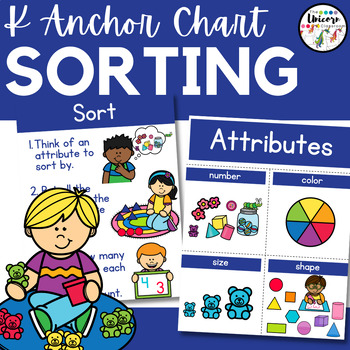
Sorting Poster and Anchor Chart | Kindergarten Math Data Unit
**This resource can be found WITHIN two other resources. If you want to purchase this product, consider purchasing a larger resource that it is found in- Kindergarten Math Yearlong Curriculum OR my Kingergarten ANCHOR CHART BUNDLE! <-- Grab the bundle at the DISCOUNTED price before I add all the resources. Also be sure to FOLLOW my store for more FLASH FREEBIES and 1/2 OFF discounts on new products.**Included in this resource are 2 posters / anchor charts to help you teach your kindergarten
Subjects:
Grades:
PreK - 1st
CCSS:
Are You Ready for Some FOOTBALL? (Middle School MATH Project)
Are you looking for a unique way to engage your students in authentic math concepts using real-world data that will blow their socks off? If so, this is your project! I have used this with eighth graders, but it would work well with any middle school performance indicators. This project involves so many performance indicators - estimation, rational numbers, scientific notation, number & word forms, budgeting, graphs, statistics, integers, media, cooperative learning, research, technology, vi
Subjects:
Grades:
5th - 8th
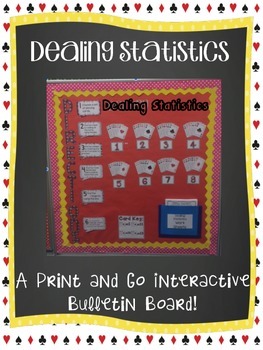
PRINTnGO INTERACTIVE MATH BULLETIN BOARD-Dealing Statistics
Dear teachers,Please enjoy Print and Go Interactive Math Bulletin Board-Dealing Statistics Edition. My students loved my interactive boards last year. They would find even the littlest minute working on them entertaining. I used mine last year as a station, or as a bell ringer, or even as an early finisher wall.This edition of the P&G Bulletin Boards is Dealing Statistics. Students are given instructions and a worksheet to write down answers on. Once this wall is set up, not only do you have
Subjects:
Grades:
5th - 7th
CCSS:
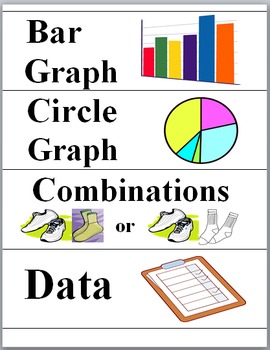
Statistics, Probability, Data and Graphs Illustrated Math Word Wall
The vocabulary and concepts included are sets, data, mean, medium, minimum, mode, range, survey, tally, charts, diagrams, graphs, key, probability, combinations, and tree diagrams.
This is an updated file.
Each of the 42 cards has a colorful illustration.
These cards can also be used as flashcards, Bingo Calling Cards, etc.
These Math Word Wall cards could be printed on card stock or photo paper and laminated, if desired.
*********************************************************************
Subjects:
Grades:
2nd - 6th
Also included in: Math Word Wall Bundle Grades 3, 4, 5
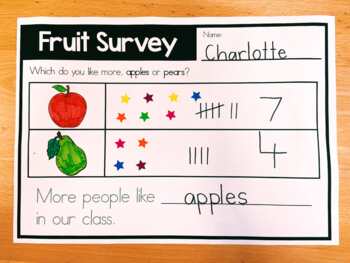
Graphing & Data Collection Class Survey Worksheets
This resource includes worksheets to help students practise graphing and data collection. Students will practise using tallies, collecting data by asking questions and recording and analysing data. This makes an adorable bulletin or board display!This resource can be used for whole-class 'tuning in' sessions or used individually or in small groups. There are Graphing and Data Collection File Contents:- 2 versions with 18 different survey options (one version with printed sentence and one with tr
Subjects:
Grades:
K - 3rd
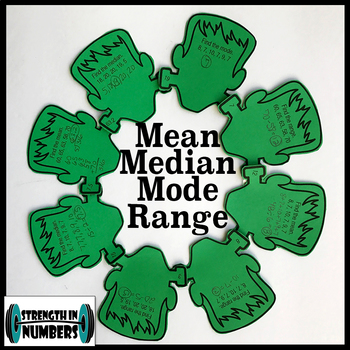
Mean Median Mode Range Halloween Frankenstein Monster Wreath
Your students will love this Frankenstein wreath. They will practice eight problems involving mean, median, mode, and range. Attaching each piece to the next piece with the correct answer makes a wreath. All my favorite things - self-checking, colorful, and wall-worthy! So adorable to display for Fall or Halloween.Don't forget to earn TPT credits towards FREE products when you leave feedback! :)Check out my PAPER CHAINS:One and Two Step InequalitiesEaster – Solving ProportionsBasketball - Sl
Subjects:
Grades:
5th - 8th
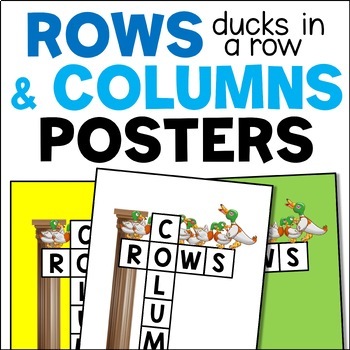
Rows & Columns Math Posters, Classroom Poster for Visual Support, Ducks In A Row
Students often get confused about the directions of rows and columns! These posters serve as a visual reference for the classroom wall so that students can easily learn and remember which directions columns and rows go. What you getThe visual for rows in this resource is 'ducks in a row'. I have another set of posters where the visual for rows is an oar. Both sets also come together in a bundle.There are 6 posters - each with a different color background to choose from.To see more informationCli
Subjects:
Grades:
1st - 3rd
CCSS:
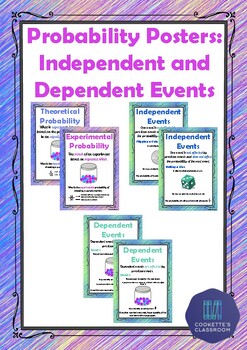
Probability Independent and Dependent Events Posters
These posters describe and provide examples of independent and dependent events and theoretical and experimental probability.The independent events posters use dice rolls and coin tosses as examples and come in 2 different versions. Version 1 has each type of event on a different poster while Version 2 has them on the same poster.The coin flip posters also come in different currencies:Australian DollarUS DollarCanadian DollarPoundEuroIf you would like these posters in a different currency, feel
Subjects:
Grades:
3rd - 8th
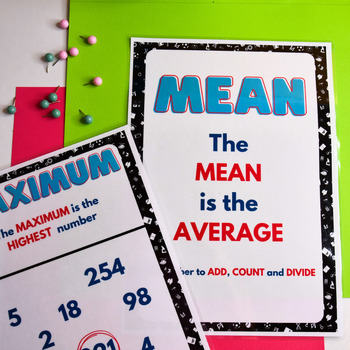
Mean, Median, Mode & Range Classroom Posters Set | Math, Statistics, Data
These measures of central tendency posters are perfect for teaching mean, median, mode and range in your classroom when exploring statistics and data in math.Our beautifully designed posters provide clear and concise explanations of each concept and colorful examples that will capture your students' attention and keep them engaged. With these posters in your classroom, your students will be constantly reminded of these essential statistical concepts and easily apply them to real-world problems.
Subjects:
Grades:
5th - 8th
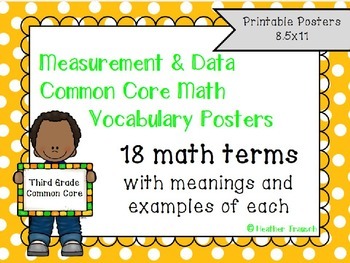
Measurement and Data Common Core Math Vocabulary Posters- Grade 3
Common Core Math Vocabulary posters aligned with all Measurement & Data (3.MD) skills for Third Grade Math Common Core instruction. Includes 18 math terms, meanings and examples for each.
Terms included in this pack: area, bar graph, dimension, elapsed time, gram, hour, minute, kilogram, length, line plot, liquid volume, liter, mass, perimeter, pictograph, second, square unit, and width.
Please see my store for poster sets in each of the 4 other Common Core Math Strands for Third Grade! O
Subjects:
Grades:
3rd
Types:
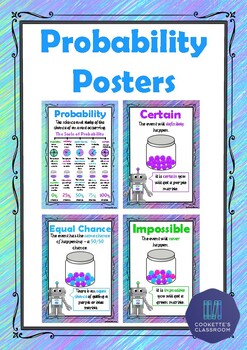
Probability Posters
These Probability Posters define the terms certain, likely, equal chance, unlikely and impossible. Also included is a Scale of Probability poster.Each poster provides a definition of each term and an image example to help your students understand each term.❀❀❀❀❀❀❀❀❀❀❀❀❀❀❀❀❀❀❀❀❀❀❀❀❀❀❀❀❀❀❀❀❀❀❀❀❀❀❀❀❀❀❀❀❀Don't forget to check out my other probability posters:Probability Independent and Dependent Events PostersAlso check out my other maths posters:Addition Strategy PostersSubtraction Strategy Posters
Subjects:
Grades:
K - 8th
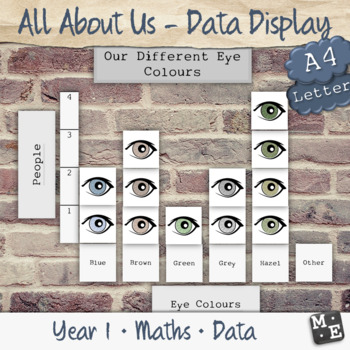
GRAPHING DATA Whole Class Gather and Represent Printable Picture Wall Display
Immerse your students in the process of representing their personal traits and characteristics as discrete data points, with this whole class printable data display. Simply choose from the selection of topics, ask students to represent their own self by colouring one of the corresponding data points, then invite them to add their picture to the bar or column graph (your choice) to represent the range of responses of the whole class.Through participation, students will:investigate a matter of int
Subjects:
Grades:
K - 2nd
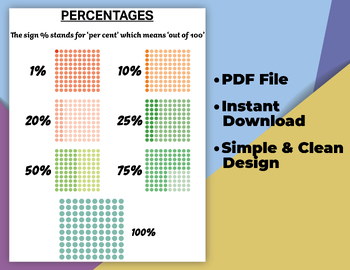
PERCENTAGES Poster for Kids, Educational Poster, Homeschool, Math Posters.
Elevate your math classroom and help students master the world of percentages with our "Percentages Poster Decor ." This printable resource is designed to simplify the understanding of percentages and create an engaging and visually appealing learning environment in your classroom. Explore the World of Percentages:Our poster decor set invites students to dive into the world of percentages. It's a dynamic educational tool that demystifies this important mathematical concept and makes it accessibl
Subjects:
Grades:
PreK - 5th
Also included in: Mega Math Bundle!!! 17 Posters.

Rows & Columns Math Posters, Classroom Posters for Math Visual Support, Oar
Students often get confused about the directions of rows and columns! These posters serve as a visual reference for the classroom wall so that students can easily learn and remember which directions columns and rows go. What you getThe visual for rows in this resource is an oar (you 'row' with an oar!). I have another set of posters where the visual for rows is 'ducks in a row'. Both sets also come together in a bundle.There are 6 posters - each with a different color background to choose from.T
Subjects:
Grades:
1st - 3rd
CCSS:
WEATHER EDUCATION DAY: METEOROLOGY CHARTING ACTIVITY: GRS. 3-7
Students research and fill in the weather stats. It can be used as an internet activity, too. Thanks so much for visiting and supporting the House of Knowledge and Kindness. May your skies be blue!
Subjects:
Grades:
3rd - 7th, Staff
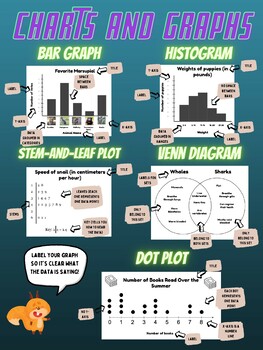
Poster - Graphs (Bar Graph, Histogram, Dot Plot, Stem and Leaf, Venn Diagram)
Classroom poster illustrating the standard features of a bar graph, histogram, stem-and-leaf plot, Venn diagram and dot plot. Great resource to help students read and interpret data, as well as make their own graphs with all the necessary features to make it readable. I hang this in my classroom so that when we're doing our unit on data representation, students can refer to it and make sure their graphs are clear and understandable. Students love the bright colors and fun content of the graphs.
Subjects:
Grades:
4th - 7th
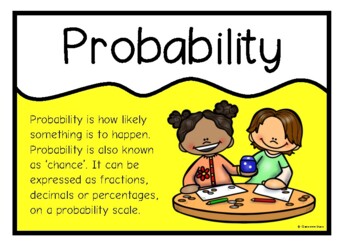
Probability | Information Poster Set/Anchor Charts | Math Centers
A set of 13 printables that give a range of information on probability. Includes: title page, what is probability?, high and low probability, probability as fractions, percentages, decimals, probability scales, working out probability, certain, likely, even chance, unlikely, impossible.Buy this resource in a Bundle and SAVE OVER 20%**Probability Bundle Pack**You might also like our resources on: Probability StatementsCharts and GraphsDrawing a Bar ChartAveragesTreetop Displays - printable poster
Subjects:
Grades:
3rd - 6th
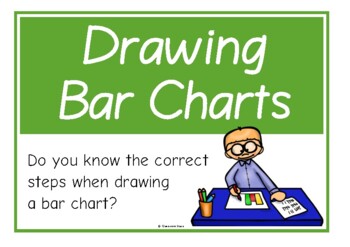
How to Draw a Bar Chart/Graph Poster Set/Anchor Charts | Math Centers
A set of 13 printables showing all the necessary steps for how to draw a bar chart successfully. This set is ideal to have as a generic display in the classroom as well as to use as a resource during lessons on statistics!Buy this resource in a Bundle and SAVE OVER 20%**Charts & Graphs Bundle Pack**You might also like our resources on: Charts and GraphsProbabilityProbability StatementsAveragesTreetop Displays - printable posters, classroom resources and bulletin board ideas
Subjects:
Grades:
3rd - 6th
Vocabulary Cards-Probability, Graphing, Mean/Median/Mode/Range, & more!
These vocabulary cards are perfect to display in a pocket chart or on a bulletin board during a probability and graphing unit. Many words include examples, and they are large enough to see from across the room. The cards are easy to make - simply print them on cardstock, cut them out, and laminate for durability. Mount them on colored construction paper if you'd like to enhance add some color to your display! Scroll over the thumbnail to see all the words in the file.
You might also be inte
Subjects:
Grades:
3rd - 12th
Probability Statements Task Cards with Blanks
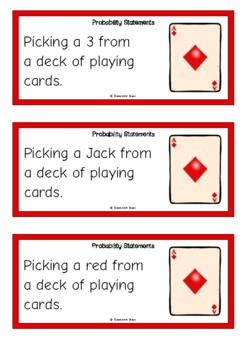
A printable set of 36 probability statements that prompt children to use their knowledge of probability. There are 4 different forms of statements - playing cards, coin flipping, dice rolling and marbles(12 statements for each type). Also includes blank prompts for teachers own use.Buy this resource in a Bundle and SAVE OVER 20%**Probability Bundle Pack**You might also like our resources on:ProbabilityCharts and GraphsDrawing a Bar ChartAveragesTreetop Displays - printable posters, classroom res
Subjects:
Grades:
3rd - 6th
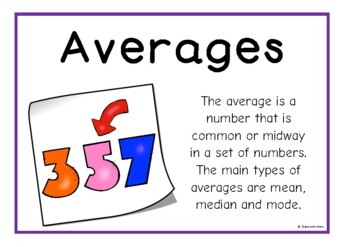
Averages including Mean, Mode & Median | Information Poster Set
A set of 10 printables that explain averages. Includes: title page, what are averages?, mean, mode, median (with one middle number), median (with two middle numbers), range and 3 pages that ask questions on averages.You might also like our resources on: Charts and GraphsDrawing a Bar ChartProbabilityProbability StatementsTreetop Displays - printable posters, classroom resources and bulletin board ideas
Subjects:
Grades:
2nd - 6th
Showing 1-24 of 57 results


