5 results
7th grade statistics webquests for Google Apps

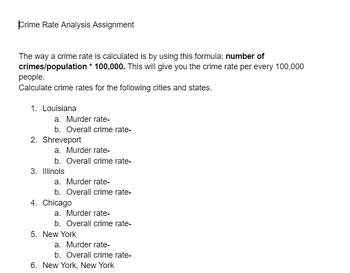
Crime Rate Analysis Assignment
A web based assignment to allow students to calculate the crime rates of various U.S. cities.
Grades:
5th - 12th, Higher Education, Adult Education
Types:

Misleading Graph WebQuest
This editable Google Doc contains 10 questions and is to be used with the following website:5 Ways Writers Use Misleading Graphs To Manipulate YouI also recommend starting the lesson by showing the following YouTube videos:How to spot a misleading graphHow statistics can be misleading
Subjects:
Grades:
6th - 12th
CCSS:

Data and Information WebQuest and Media Piece Project
Data and Information WebQuest and Media Piece ProjectDescription:Dive into the fascinating world of data and information with our engaging Data and Information WebQuest and Media Piece Project! Designed for students in grades 6-10, this resource takes learners on a journey to explore data representation, storage and retrieval, and the basics of databases. After completing the WebQuest, students will showcase their understanding by creating a media piece (PowerPoint presentation, Google Slides, i
Grades:
6th - 12th
Types:
Also included in: The Cybersecurity and Computer Science Master Collection for Grades 6-12

Break in puzzle: Data Review
This is a "solution" to the virtual "escape room" style puzzle that can be found at: https://scratch.mit.edu/projects/844573647/Note: if you like puzzles - you might want to try the puzzle first before diving into a solution because this spoils everything.If you / your students enjoy the puzzle and you want to "tip" me (unnecessary - but appreciated), you can either comment here or in scratch with links to other similar free resources you've come across so I can check them out - or monetary tip
Subjects:
Grades:
7th - 11th
Types:

Measures of Center & Variability Practice | EDITABLE!
Great activity for your students to collaborate online or in class.Students tell the number of 4 things that they have and share with 3 other students. They then find the mean, median, mode, range, Q1, Q3 and IR for the four items.This is EDITABLE so you can make it fit the needs for your class. I had my students post a video of their items using FlipGrid, so they could choose anyone from the class to use data from. You could also make it webquest with your own data! :) Check out my notes for t
Subjects:
Grades:
6th - 9th
Types:
Showing 1-5 of 5 results


