5 results
Common Core 1.MD.C.4 webquests

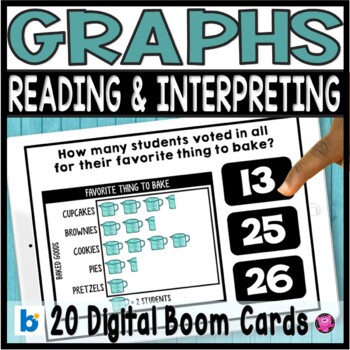
Reading Pictographs - Picture Graphs - Reading and Interpreting Data
These DIGITAL Picture Graphs are a super fun and interactive math activity for your 1st, 2nd, and 3rd grade students to practice reading, analyzing, and interpreting data! Students will answer use picture graphs, and bar graphs to answer questions like: most/least favorites, totals for each group, and compare, analyzing, and interpreting data. Boom Card can be used with Google Classroom, SeeSaw, ClassDoJo and other platforms. Click here to SAVE 20% on my Graphing Bundle!PLEASE NOTE YOU ARE PURCH
Subjects:
Grades:
1st - 3rd
Types:
Also included in: Kindergarten Math Worksheets Games and Centers YEAR-LONG BUNDLE

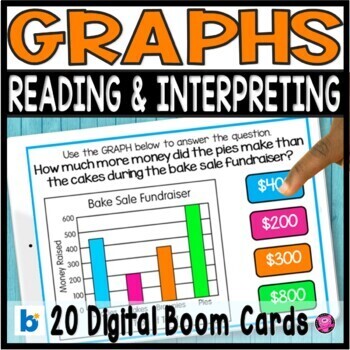
Bar Graphs and Picture Graphs Reading & Analyzing Data Digital Boom Cards
Teaching second and third grade students how to read and interpret data, solve one- and two-step "how many more" and "how many less" problems using information presented in scaled bar graphs will be fun and engaging using these 20 DIGITAL Boom math tasks! Students will practice common core 3.MD.B.3 graphing activities using multiple representations of graphs including data tables, bar graphs, line graphs, and pie graphs. The questions are differentiated for a wide range of learners.Click here to
Subjects:
Grades:
2nd - 3rd
Types:
Also included in: Graphing and Date Analysis Reading and Interpreting Graphs and Data

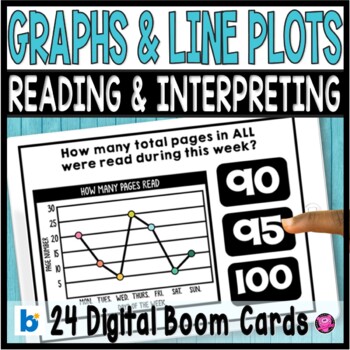
Graphing and Data - Bar Graphs Line Plots Pictographs 3rd Grade DIGITAL Tasks
Teaching your 3rd and 4th grade students how to read, interpret, and analyze dat data using bar graphs, line plots, and picture graphs will simple and easy using these 24 DIGITAL math tasks. Students will practice answering questions like: "how many more", "how many less", and "compare data" using line plots and pictographs. Boom Card can be used with Google Classroom, SeeSaw, ClassDoJo and other platforms. Click here to SAVE 20% on my Graphing Bundle!PLEASE NOTE YOU ARE PURCHASING A LINK TO ACC
Subjects:
Grades:
1st - 3rd
Types:
Also included in: Graphing and Date Analysis Reading and Interpreting Graphs and Data

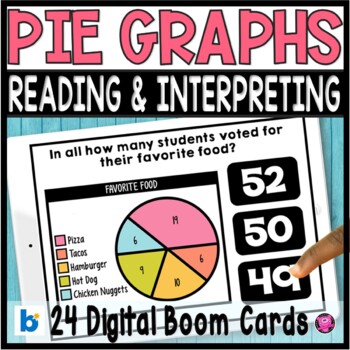
Pie Graphs Interpreting and Reading Data - Digital Boom Cards Pie Graphs
Teaching students how to read and interpret data, solve one- and two-step "how many more" and "how many less" problems using information presented in scaled bar graphs and pie graphs will be fun and engaging using these 24 DIGITAL Boom math tasks! Students will practice common core 3.MD.B.3 graphing activities using multiple representations of graphs including data tables, bar graphs, line graphs, and pie graphs. The questions are differentiated for a wide range of learnersClick here to SAVE 20%
Subjects:
Grades:
1st - 3rd
Types:
Also included in: Graphing and Date Analysis Reading and Interpreting Graphs and Data

Distance Learning K-6 Math Game App (Support IOS & Android)- Covid FREE Software
[Covid19 Notice: We want to do our part and give back to the community during this trying time. And we are making the app completely FREE$̶1̶9̶.̶9̶0̶ for School year 2020. Just claim this free app and let the fun begin! And please leave 5-Stars review ⭐⭐⭐⭐⭐ if you find it useful. Thanks]NImbleArt Zapzapmath-School teaches math in a fun, visual and interactive way. And, teachers will be able to check on student’s progress via a Web Dashboard. Let’s see what else are added to the equation: Access
Grades:
PreK - 6th, Adult Education, Staff
Showing 1-5 of 5 results

