
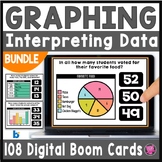
Bar Graphs and Picture Graphs Reading & Analyzing Data Digital Boom Cards


- PDF
- Internet Activities
- Webquests
Also included in
 Ready to challenge your second and third grade students understanding of interrupting data on different types of graphs? This DIGITAL Boom Cards Interpreting and Analyzing Graphing BUNDLE gives you read-to-teach activities to help students understand beginning concepts and strategies needed to interPrice $15.99Original Price $20.00Save $4.01
 This is a YEAR-LONG DIGITAL and PRINTABLE Next Generation Science Standard (NGSS) Science Bundle for 2nd grade and 3rd grade. This MEGA Science Bundle includes science interactive notebook foldables, science lessons and hands-on activities for matter, rocks, weather, plants, animals, habitats, energPrice $110.00Original Price $222.74Save $112.74
Description
Teaching second and third grade students how to read and interpret data, solve one- and two-step "how many more" and "how many less" problems using information presented in scaled bar graphs will be fun and engaging using these 20 DIGITAL Boom math tasks! Students will practice common core 3.MD.B.3 graphing activities using multiple representations of graphs including data tables, bar graphs, line graphs, and pie graphs. The questions are differentiated for a wide range of learners.
Click here to SAVE 20% on my Graphing Bundle!
Graphing and Data Word Problem Digital Boom Cards Includes:
- A link to BOOM Learning ℠ to access the 20 Digital Task Cards on the BOOM Learning website
- Teacher Notes on how to use BOOM Cards ™ in your classroom
- Instruction for Using with Google Classroom
- Four multiple-choice options for each task
More About BOOM Learning℠
To use Boom Cards, you must be connected to the Internet. Boom Cards play on modern browsers (Chrome, Safari, Firefox, and Edge). Apps are available for Android, iPads, iPhones, and Kindle Fires. For security and privacy, adults must have a Boom Learning account to use and assign Boom Cards. You will be able to assign the Boom Cards you are buying with "Fast Pins," (play provides instant feedback for self-grading Boom Cards). Fast Play is always a free way for students to engage with Boom Cards decks. For additional assignment options you'll need a premium account. If you are new to Boom Learning, you will be offered a free trial of our premium account. Read here for details: http://bit.ly/BoomTrial.
Other resources you may find helpful can be found by clicking on the links below.
Boom Cards Distance Learning - Reading and Grammar BUNDLE
STEAM Activities: ELA Cereal Box Challenge
Math Multi Step Word Problem Digital Boom Cards - Distance Learning
CLICK here to FOLLOW me and SAVE 50% off my products the FIRST 24 HOURS POSTED!
Click on the links below to follow me on Social Media and get to know the author behind Oink4PIGTALES!
Copyright ©Oink4PIGTALES
