14 results
Middle school basic operations simulations for Microsoft PowerPoint

Stock Market Crash Simulation Activity│1929 │Great Depression │PowerPoint Game
This interactive PowerPoint activity will review the climate of the 1920's and introduce the basic of trading on the stock market to your 5th graders.Students will work together in "investment teams" and trade on the stock market with their starting $1,000. The game winds its way through the 1920s, eventually crashing on Black Tuesday. I highly recommend using this as an activity to introduce the stock market crash. The first time I tried this activity, I had already taught about Black Tuesda
Grades:
5th - 8th
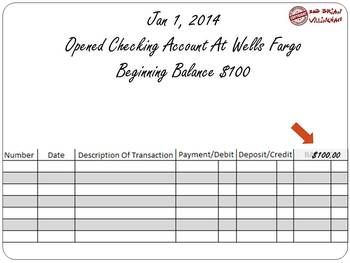
Checking Account Simulation
Do you need a lesson to teach students how to balance a checkbook? A PowerPoint presentation is included instructs students on how to balance their own checkbook and then gives them some "real world" practice. The PowerPoint includes writing a check, using a debit card, and making deposits. Also included is the handouts that you will give students in order for them to participate in the simulation. One handout is a checkbook register and the other handout has blank checks that students will writ
Grades:
6th - 12th, Higher Education, Adult Education

Distributive Property: Changing Expressions
This 22-slide PowerPoint presentation demonstrates how to use common factors and the distributive property to change an expression. Addition problems involving whole numbers are changed into a multiplication problem which is the product of the greatest common factor of the addends and the sum of two whole numbers that have no GCF other than "1". The content is based on 6th grade Common Core standard: CCSS.Math.Content.6.NS.B.4. The presentation takes about 30 minutes, but time considerations dep
Subjects:
Grades:
6th
CCSS:
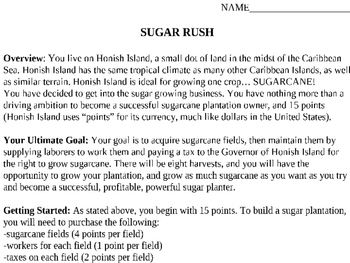
Caribbean Economy Simulation (Supply and Demand/Single Crop)
In this simulation, students will play the role of Plantation owner and will try to grow their sugarcane empire through buying and selling fields, paying workers' wages and government taxes, and reaping the profit after each harvest. However, it also demonstrates the law of supply and demand and teaches a lesson about diversifying your economy as the price of sugarcane fluctuates on the world market from harvest to harvest. Students wait in breathless anticipation as each harvest price is reveal
Subjects:
Grades:
6th - 9th
Types:
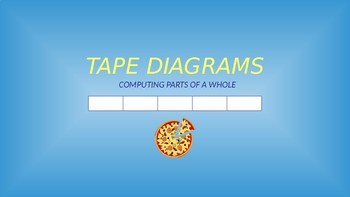
Tape Diagrams: Computing Parts of a Whole
This PowerPoint presentation serves as an introduction to solving problems that involve finding parts of a whole by using tape diagrams. The process is clearly explained and modeled including examples using fractions and percents converted to fractions. The product can be used as an interactive class lesson or for individual student use due to absence or remediation. The amount of time spent using this presentation will vary depending on the teacher's usage of stopping points and/or student inte
Subjects:
Grades:
6th
CCSS:

Unit Rate: A Special Type of Ratio
This 18-slide PowerPoint presentation introduces the concept of a unit rate. It assumes students have already learned about the concept of a ratio. The material is based on Common Core 6th grade math standard: CCSS.Math.Content.6.RP.A.2. The presentation begins with a problem trying to compare two ratios to determine the best gas mileage. A tape diagram model is used to transform the ratios into unit rates to see how much more helpful they are when making comparisons. Unit rates are calculated u
Subjects:
Grades:
6th
CCSS:
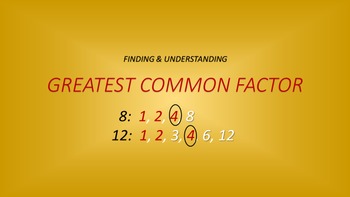
Greatest Common Factor
This 28-slide PowerPoint presentation guides you through the process that leads to finding the greatest common factor of given numbers. It can be used for full class or individual instruction. The time you spend on this presentation depends on how much student involvement you allow and stopping points encountered for emphasis. This presentation is a great reference to place on your teacher webpage as well. The content is based on the 6th grade Common Core math standard: CCSS.Math.Content.6.NS.B.
Subjects:
Grades:
6th
CCSS:

Decimal Multiplication
This 19-slide PowerPoint presentation develops the procedures used to multiply decimal numbers. This presentation is based on the 6th grade Common Core math standard: CCSS.Math.Content.6.NS.B.3. It can be used for class or individual instruction. Use it on your teacher web page as a student resource when needed. The presentation should take about 20-30 minutes of class time depending on stopping points you find necessary and student participation. The presentation begins demonstrating how you li
Subjects:
Grades:
6th
CCSS:
Conceptual Understanding for Operations: Rectangular Models
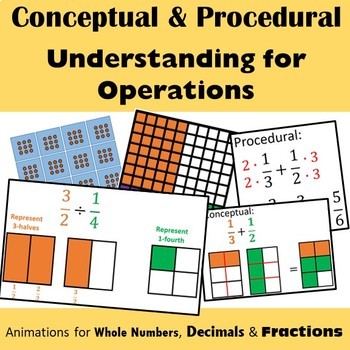
This PowerPoint includes animations for operations of whole numbers, decimals fractions and place value with rectangular models. You can demonstrate to students side-by-side the procedural and conceptual steps to add, subtract, multiply and divide rational numbers. To properly show animation, present to Presentation View. This item is designed to make teachers' explanation of operations meaningful and connect different levels of rigor. Topics include: place value, adding whole numbers, subt
Subjects:
Grades:
1st - 9th, Adult Education
FREE VERSION - Additive Inverse & Zero Pair Ninjas for teaching Integers
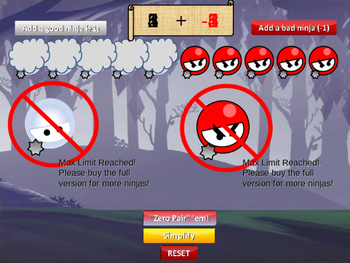
Do you need an interactive, fun, and engaging way to teach integers, zero pairs, or additive inverses? This PowerPoint is your answer, and will allow students to visually see what is happening when you add integers. It uses "good" and "bad" ninjas to demonstrate concepts of additive inverse and zero pairs.
If your student is not understanding how to add or subtract integers, please give this a try. Your students will love it! Mine do!
This is the free version where you are limited to 10 ninjas
Subjects:
Grades:
6th - 10th
Least Common Multiple
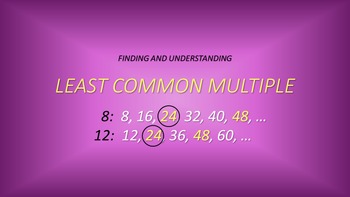
This 18-slide PowerPoint presentation uses word problems to explore the role of multiples in solving them. It begins with defining a multiple before being introduced to problems involving common multiples. In the first problem you're looking for several common multiples over a period of time. The second problem is looking for the next time an events occur simultaneously (LCM). After summarization there is a problem students can work along with solution so they can check their work. The presentat
Subjects:
Grades:
6th
CCSS:
Reduced Multiplication Tables
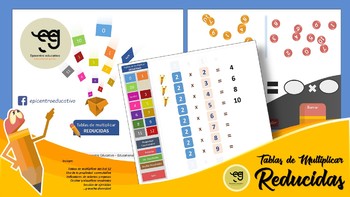
In this method of the "reduced multiplication tables", we use the propiety conmutative, reducing terms in each one of them, memorazing with the minimum effor and getting the best results. Enjoy it!.
Subjects:
Grades:
3rd - 6th
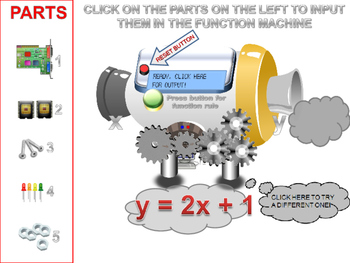
FREE VERSION - The TOM Function Machine Converting Inputs into Outputs
The TOM Function Machine is an interactive Power Point that will allow your students to visually see a value being inputted into the machine, and an output that results.
You control when the input is entered and when the output is shown, giving you time and opportunities to have discussions with students. After visually seeing input-output relationships, students can guess what the function rule is. Your press a button to reveal the rule and see if students were correct.
See it in action here
Subjects:
Grades:
6th - 10th
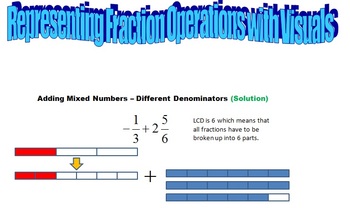
Using Visuals to Model Fraction Operations
This PPT helps kids make sense of fraction operations by using visuals to illustrate them. The PPT can be customized to meet your needs, as you can click and drag whole bars or individual pieces.
Subjects:
Grades:
5th - 8th
Types:
Showing 1-14 of 14 results


