15 results
Statistics projects for Easel
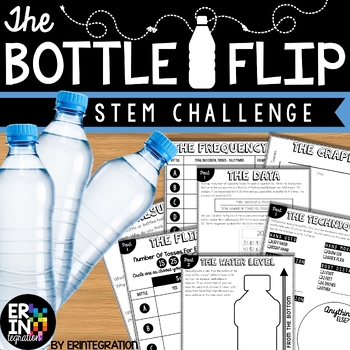
Water Bottle Flip STEM Challenge + STEM Activity
The ORIGINAL water bottle flip STEM activity and lab! Water bottle flip at school? Absolutely! Students will love this on-trend STEM challenge inspired by the popular YouTube water bottle flipping challenge where students toss a water bottle and attempt to land it straight up. Practice scientific method with some probability, fractions and data collection in the mix while having fun!This self-paced, low-prep, project based learning water bottle flip STEM challenge is print-and-go. Each activit
Subjects:
Grades:
3rd - 6th
Types:
CCSS:
NGSS:
K-2-ETS1-2
, K-2-ETS1-3
, MS-ETS1-2
, K-2-ETS1-1
, 3-5-ETS1-3
...
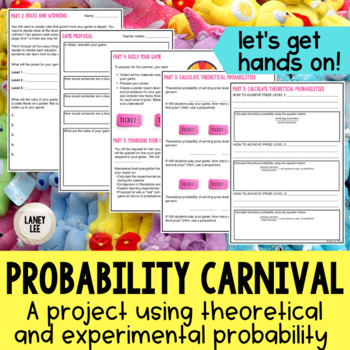
Probability Carnival Game Project - PDF & Digital
Looking for a fun, hands on way to bring probability to life? Are you ready to move past the "sit and get" style of whole group instruction? If you answered yes to either of those questions, then this resource is for you!Keep your students engaged and accountable with the interactive, versatile Probability Carnival! The steps of this project are designed to be rigorous and require students to predict, reflect, connect, and think critically about the situations being investigated.Using this proje
Subjects:
Grades:
6th - 8th
Types:
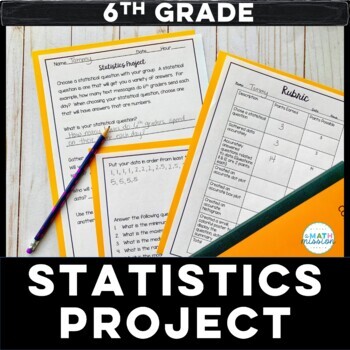
Math Statistics Project Based Learning Dot Plot Box Plot Histogram
Set your students loose to practice their statistics skills! This project is great for a culminating assessment. This project is centered around students coming up with a statistical question, and gathering data on that question. Students answer statistical questions, and create a dot plot, box and whisker plot and histogram based on the data collected. A summary of their findings is then created to display for others to see. A rubric is included for grading purposes. This project actively
Subjects:
Grades:
5th - 7th
Types:
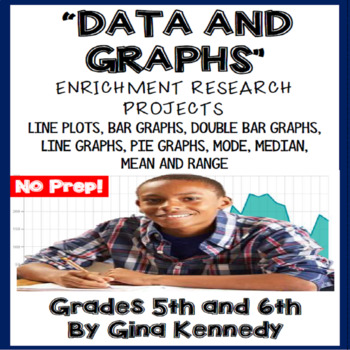
Data and Graphs Projects, 5th and 6th Grade Math Enrichment
Fun Data and Graph Enrichment Projects Students Love! Nine fun math projects that range from finding distances from cities to Olympic records and even charting calories on a super sized cheeseburger. The fun and creative projects utilize line plots, line graphs, bar graphs, double bar graphs, pie/circle graphs, mode, median, mean and range. I've also included a set of vocabulary terms, sample graphs and and a rubric! Print and go math enrichment! Perfect for distance learning as well.Please che
Subjects:
Grades:
4th - 6th
Types:
4th Grade Data & Line Plots, 30 Enrichment Projects and 30 Test-Prep Problems
No-prep, 4th Grade data and line plots practice with 30 enrichment projects and 30 review test-prep questions aligned to the standards. Great for teaching the important data standards in a fun, engaging way. Excellent for early finishers, advanced math students or whole class practice. Print and go math enrichment! These work perfectly for distance learning as well.This resource includes thirty 4th Grade Common Core data and line plots problem solving test-prep questions and 30 no-prep data and
Subjects:
Grades:
4th
CCSS:
Also included in: 4th Grade Math Projects For Every Standard! Enrichment All-Year Bundle!
Data Project, Crazy Data Math Enrichment Project!
Data And Graphs Enrichment Project For Upper Elementary! With this project, your students will love making up their own data based on a chosen topic from a provided list. Once they've chosen their topic from such funny themes such as "ants in the pants', they will begin creating their data graphs based on the step-by-step directions included with this project. The students will then begin creating questions for other students to answer based on the data presented in their graphs. A fun way ha
Subjects:
Grades:
4th - 5th
Types:
Also included in: Math Projects "BUNDLE"! Print and Go Math Enrichment All Year!
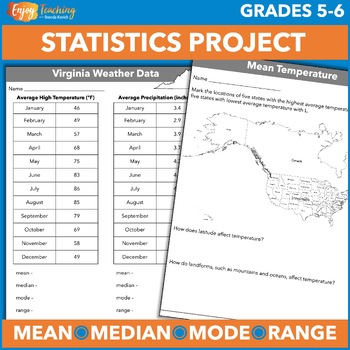
Mean, Median, Mode, Range Project – Activities and Worksheets – States Weather
Looking for an authentic math project to reinforce mean, median, mode, and range? Try these weather activities. Fifty worksheets provide monthly temperature and precipitation data for states of the USA. After crunching the numbers, kids use maps to apply and think critically. Open the preview to take a closer look at the fifth or sixth grade statistics activities. First, kids learn about or review four types of data analysis. A set of anchor charts kick off the project. They explain in words and
Subjects:
Grades:
5th - 6th
Types:
Halloween Math "Data and Graphs" Projects
NO-PREP! Students will love the Halloween "themed" math data and graphs projects in this resource. From bar graphs,stem-and-leaf plots, line plots to line graphs and more, the projects are a fun way to apply data skills to real-life Halloween data. With the projects in this resource, your students will be researching such data as calories in fun size candy bars to the top pumpkin producing countries in the world. I've also included an example sheet for each type of graph used in the resource
Subjects:
Grades:
4th - 5th
Types:
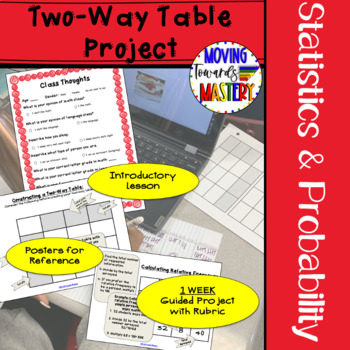
Two Way Frequency Tables End of Year Project Plan
ONE Week guided project plan for constructing and interpreting two-way frequency tables. This engaging project is individualized to allow students to research areas of interest. Can be used year round but is great for an end of year project! Students will gather data on their topic of choice and use the project plan to organize their data into a two way table and frequency table. Students will then analyze the results of the data collection.Two-Way Table Project includes:♦ Suggested Lesson Plann
Subjects:
Grades:
8th - 10th
Types:
CCSS:
Also included in: Middle School Math Projects for End of the Year Activities
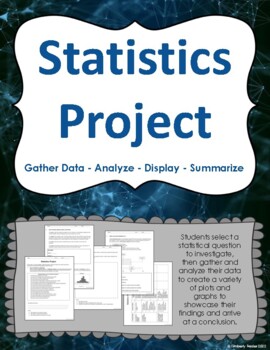
Statistics Project Data Display Poster Project / Box Plot / Histogram / Dot Plot
Dive into statistics and data displays with your students! Students come up with a statistical question, gather and analyze data to create a series of data displays to create a poster.Students work through their poster project to complete the following activities:1. Choose a statistical question2. Gather data3. Create a dot plot or stem-and-leaf plot4. Calculate the mean, median, mode and range5. Create a bar graph or histogram6. Create a box-and-whisker plot7. Summarize and conclude findings8.
Subjects:
Grades:
5th - 8th
Types:
Linear Regression Project college value
Use linear regression for college selection with this linear regression project. Great for AP Statistics. Use the data provided in the resource or have students generate their own data to analyze, calculate residuals, and more on the value of college as related to rankings or career earnings. This project is part of the AP Statistics curriculum.Included in this resource:Linear Regression project examining relationship between college tuition costs and college rankingsLinear Regression proj
Subjects:
Grades:
9th - 12th
Types:
CCSS:
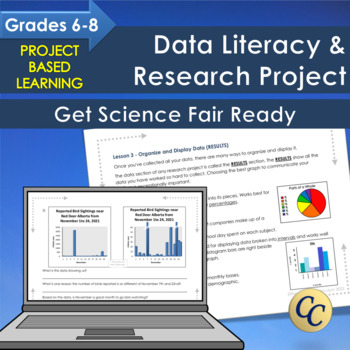
Get Science Fair Ready! Project Based Learning Data Literacy for Middles School
Science fair project that helps you teach data management, statistics and probability. Real data and meaningful science! The data literacy and research project covers everything middle school students need to know about collecting and interpreting data for their own animal observation observation project. Great for science fairs! Learn about collecting objective, non-bias data and how to recognize it in the real world. → Everything is included to have students learn about data, collect data and
Subjects:
Grades:
6th - 8th
NGSS:
MS-LS2-1
Also included in: Canadian Grade 6 Math Bundle | For Print and Easel
Math Project Scatter Plots: Are You Really Going to Eat That? *DISTANCE LEARNING
PRINT and DIGITAL * * Makes distance planning so much easier!Math Project Scatter Plots: Are You Really Going to Eat That? This math project is a fun way for your students to use bivariate data that is highly engaging and relevant to them to construct scatter plots in a real-world situation! Your students will enjoy making choices about restaurants and meals they like to eat based on their personal needs and wishes. Students will organize the nutrition data of the meals they choose using tables
Subjects:
Grades:
7th - 10th, Adult Education
CCSS:
Statistics Project
7 page introductory (or review) lesson on collecting, organizing and interpreting statistical data. Students write their own statistical questions, review concepts and show their skills! This packet includes a teacher outline, observations page, assessment and opportunities for students to create a histogram, frequency chart, box plot and more!
Clarification: 7 student pages, along with 1 teacher outline page.
Subjects:
Grades:
5th - 8th
Types:
Weather Project
Students will need to find use statistics to find data on high and low temperatures of a specific city. They will then create some sort of visual representation of their data on a poster, PowerPoint, etc. They will also need to use the data in order to create a box-and-whisker plot of their data.
Subjects:
Grades:
5th - 9th
Types:
Showing 1-15 of 15 results


