4 results
High school statistics projects for Easel
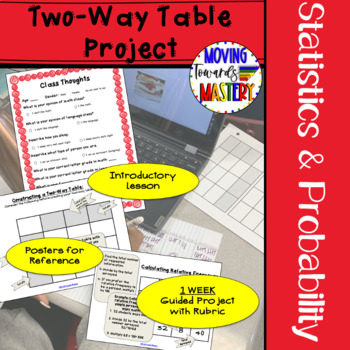
Two Way Frequency Tables End of Year Project Plan
ONE Week guided project plan for constructing and interpreting two-way frequency tables. This engaging project is individualized to allow students to research areas of interest. Can be used year round but is great for an end of year project! Students will gather data on their topic of choice and use the project plan to organize their data into a two way table and frequency table. Students will then analyze the results of the data collection.Two-Way Table Project includes:♦ Suggested Lesson Plann
Subjects:
Grades:
8th - 10th
Types:
CCSS:
Also included in: Middle School Math Projects for End of the Year Activities
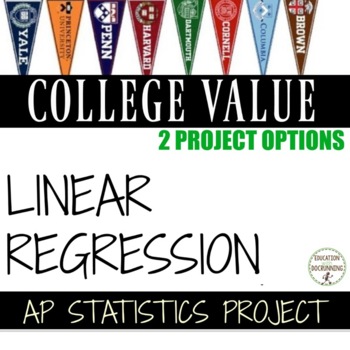
Linear Regression Project college value
Use linear regression for college selection with this linear regression project. Great for AP Statistics. Use the data provided in the resource or have students generate their own data to analyze, calculate residuals, and more on the value of college as related to rankings or career earnings. This project is part of the AP Statistics curriculum.Included in this resource:Linear Regression project examining relationship between college tuition costs and college rankingsLinear Regression proj
Subjects:
Grades:
9th - 12th
Types:
CCSS:
Math Project Scatter Plots: Are You Really Going to Eat That? *DISTANCE LEARNING
PRINT and DIGITAL * * Makes distance planning so much easier!Math Project Scatter Plots: Are You Really Going to Eat That? This math project is a fun way for your students to use bivariate data that is highly engaging and relevant to them to construct scatter plots in a real-world situation! Your students will enjoy making choices about restaurants and meals they like to eat based on their personal needs and wishes. Students will organize the nutrition data of the meals they choose using tables
Subjects:
Grades:
7th - 10th, Adult Education
CCSS:
Weather Project
Students will need to find use statistics to find data on high and low temperatures of a specific city. They will then create some sort of visual representation of their data on a poster, PowerPoint, etc. They will also need to use the data in order to create a box-and-whisker plot of their data.
Subjects:
Grades:
5th - 9th
Types:
Showing 1-4 of 4 results


