33 results
High school statistics printables for Easel
Estimating Correlation Coefficient with Scatter Plots Worksheet
Attention Math Teachers! Are you looking for a way to help your students master estimating correlation? Look no further! Our engaging worksheet is designed to match scatter plots with the correct correlation coefficient. With a variety of reasonable choices, students will estimate the correct r value and interpret positive and negative slope, as well as the strength or weakness of the correlation coefficient of a linear fit.This two-sided worksheet comes with an easy-to-use key and is perfect fo
Subjects:
Grades:
9th
Types:
CCSS:
Also included in: Data and Statistics Worksheets Bundle
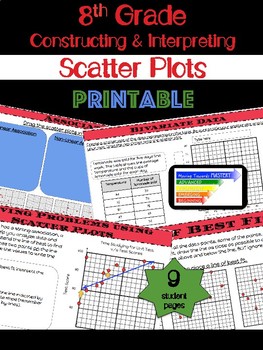
8th Grade Math Constructing & Interpreting Scatter Plots
Extensive printable lessons for constructing and interpreting scatter plots.The lessons are scaffolded to build understanding. Students will progress from identification of terms to making predictions involving bivariate data. The guided lessons will begin with identification, move towards assisted analysis, and conclude with independent practice.Lessons include...♦ Definitions and Visual Representations♦ Identification and Use of Terms → Bivariate Data → Scatter Plot → Linear, Nonli
Subjects:
Grades:
8th - 10th
Types:
CCSS:
Also included in: 8th Grade Math Common Core Growing Bundle
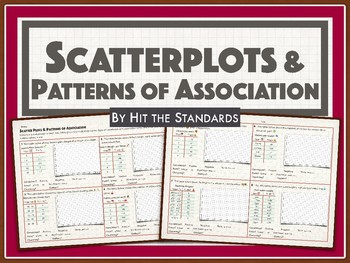
Scatterplots & Patterns of Association
Students must construct and interpret scatter plots from 8 different data tables and investigate patterns of association such as clustering, outliers, positive or negative correlation, linear or nonlinear association. Data tables are based on real world problems, students must plot the data points to construct the scatter plots. Common Core 8SP.1 & 8SP.2TEKS 8.11A Save $$$ and time by downloading the complete 8th Grade Math Unit10 Making Connections (End of Year Activities) (STAAR review) 4
Subjects:
Grades:
6th - 9th
Types:
CCSS:
Probability of Simple Events Christmas Math Coloring Sheet
Do your students love to color? Try this Probability of Simple Events Christmas Math Coloring Sheet! This Probability Coloring Sheet contains 10 finding simple events problems. Using this Christmas coloring sheet is a great way to keep students working during the holiday season! This coloring sheet is perfect for reviewing how to find the probability of simple events. Easy setup and clear directions for students make this Probability of Simple Events Christmas Math Coloring Sheet perfect for da
Subjects:
Grades:
7th - 9th
Types:
Also included in: Middle School Math Christmas Bundle 2
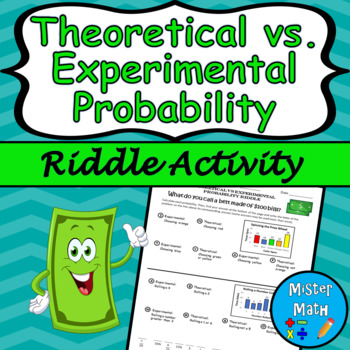
Theoretical vs. Experimental Probability Riddle Activity
Looking for a fun way for students to practice theoretical and experimental probability? This riddle activity is an engaging way for students to strengthen their skills in calculating probability while having fun! Guaranteed they will get a kick out of the terrible punchline at the end! This riddle activity contains 12 questions where students will be asked to find the theoretical and experimental probability of various events by analyzing data in bar graphs. An answer key is included.☆ Perfect
Subjects:
Grades:
6th - 9th
Types:
Also included in: Probability MEGA BUNDLE
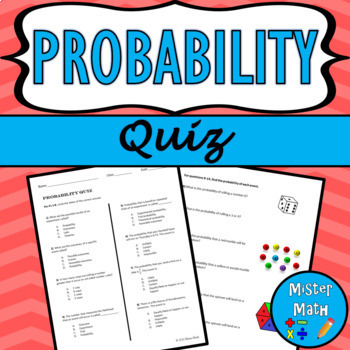
Probability Quiz
Assess your students' knowledge and skills in finding probability with this 22-question quiz! The quiz includes multiple choice and open-response questions, as well as real-life application questions. An answer key is also provided. Overall, the 4-page quiz covers the following topics:Outcomes & EventsDescribing LikelihoodSimple ProbabilityTheoretical/Experimental ProbabilityUsing Theoretical ProbabilityMaking PredictionsComparing Theoretical & Experimental Probability☆ CLICK HERE TO CHE
Subjects:
Grades:
6th - 9th
Also included in: Probability MEGA BUNDLE
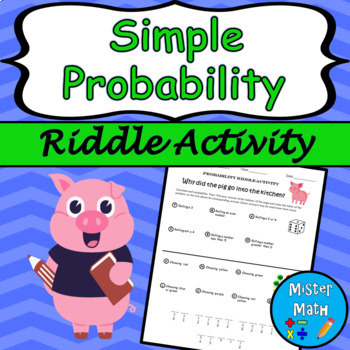
Probability Riddle Activity
Looking for a fun way for students to practice simple probability? This riddle activity is an engaging way for students to strengthen their skills in calculating probability while having fun! Guaranteed they will get a kick out of the terrible punchline at the end! This riddle activity contains 13 questions where students will be asked to find the probability of various events involving number cubes and marbles. An answer key is included.☆ Perfect for centers, partner work, independent practice,
Subjects:
Grades:
6th - 9th
Types:
Also included in: Probability MEGA BUNDLE
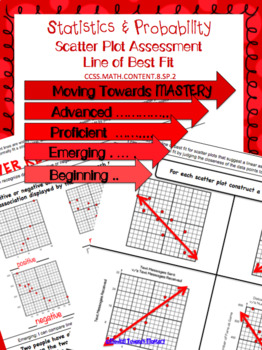
8.SP.2 Scatter Plots: Line of Best Fit Assessment
Assessment for Scatter Plots: Line of Best Fit that measures understanding at various levels of mastery to identify at what level students have progressed. Levels of mastery are:→ Beginning → Emerging→ Proficient→ AdvancedEASY printing with answer key--------------------------------------------------------------------------------------------------------------------------------------------------------------These printable worksheets can also be used as digital resources through the TpT Digital Ac
Subjects:
Grades:
8th - 10th
Types:
CCSS:
Also included in: 8th Grade Common Core Statistics & Probability Assessments
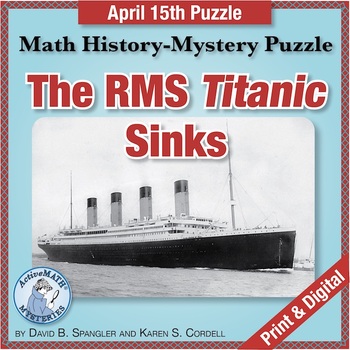
April 15 Math World History Puzzle: The Titanic Sinks | Conditional Probability
April 15 of the Mystery Year was when the passenger liner Titanic sank. In this puzzle, students use a 2-way (contingency) table to analyze conditional probabilities to determine if there is a relationship between a passenger's survival status and the passenger's ticket designation. Students solve the clues to determine the Mystery Year.Your Zip download includes printable/digital PDFs:1-page printable Student Puzzle, also prepped for Easel1-page Answer Key with sample solutions1-page version of
Subjects:
Grades:
8th - 9th
Types:
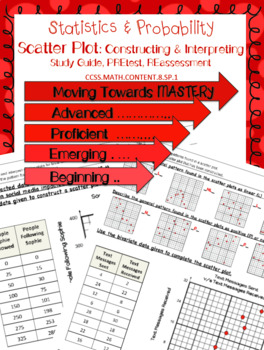
8.SP.1 Construct & Interpret Scatter Plots Pre-test/ Study Guide/ Reassessment
This resource would be useful in the following ways:→ Pre-test before introducing the standard→ Study Guide to prepare for the assessment→ Reassessment This resource will allow you to measure student understanding of how to construct and interpret a scatter plot at various levels of mastery to identify at what level students are prior to instruction or after instruction. Levels of mastery are:→ Beginning → Emerging→ Proficient→ AdvancedEASY printing with answer key-------------------------------
Subjects:
Grades:
8th - 10th
CCSS:
Also included in: 8th Grade Common Core Statistics & Probability Assessments
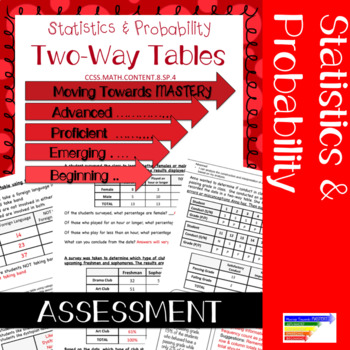
Two Way Frequency Tables Printable Test 8.SP.4 Assessment
Assessment for Two Way Frequency Tables - This printable test will measure understanding at various levels of mastery to identify at what level students have progressed. Levels of mastery are:→ Beginning → Emerging→ Proficient→ AdvancedEASY printing with answer keyCheck out resources for teaching Scatter Plots:Scatter Plot Interactive Google SlidesScatter Plot ProjectScatter Plot PRINTABLECheck out the levels of mastery tool created to introduce the standard in my store:Scatter Plot Levels of Ma
Subjects:
Grades:
8th - 10th
Types:
CCSS:
Also included in: 8th Grade Common Core Statistics & Probability Assessments
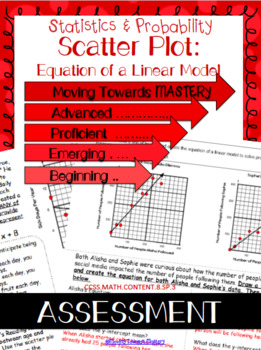
8.SP.3 Scatter Plots: Equation of a Linear Model Assessment
Assessment for Scatter Plots: Equation of a Linear Model that measures understanding at various levels of mastery to identify at what level students have progressed. Levels of mastery are:→ Beginning → Emerging→ Proficient→ AdvancedEASY printing with answer key--------------------------------------------------------------------------------------------------------------------------------------------------------------These printable worksheets can also be used as digital resources through the TpT
Subjects:
Grades:
8th - 10th
Types:
CCSS:
Also included in: 8th Grade Common Core Statistics & Probability Assessments
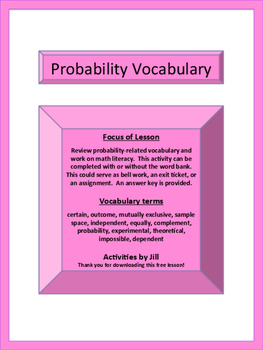
Probability Terms Worksheet with Word Bank (Distance Learning)
Focus of LessonReview probability-related vocabulary and work on math literacy. This activity can be completed with or without the word bank. This could serve as bell work, an exit ticket, a math center, or an assignment.Vocabulary termscertain, outcome, mutually exclusive, sample space, independent, equally, complement, probability, experimental, theoretical, impossible, dependentUse this note-taking product to introduce the vocabulary terms!Probability Vocabulary NotesCCSS 7.SPProbability Te
Subjects:
Grades:
6th - 9th
Types:
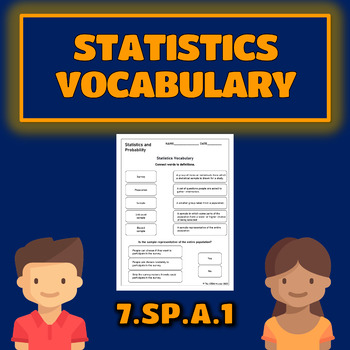
Grade 7 Math Statistics Vocabulary 7.SP.1 Worksheet
Grade 7 math statistics and probability worksheet covering statistics vocabulary survey, population, unbiased and biased sample CCSS 7.SP.A.1 7.SP.11 worksheet + answer keyCommon core assessments:✅✅✅Grade 3 Math CCSS Assessment Bundle Print & Digital✅✅✅✅✅✅Grade 4 Math CCSS Assessment Bundle Print & Digital✅✅✅✅✅✅Grade 5 Math CCSS Assessment Bundle Print & Digital✅✅✅✅✅✅Grade 6 Math CCSS Assessment Bundle Print & Digital✅✅✅Interactive slides for Google Classroom:⭐⭐⭐Grade 1 Math Inte
Subjects:
Grades:
7th - 9th
Types:
CCSS:
Also included in: 7th Grade Math Statistics and Probability 7.SP Worksheet Bundle
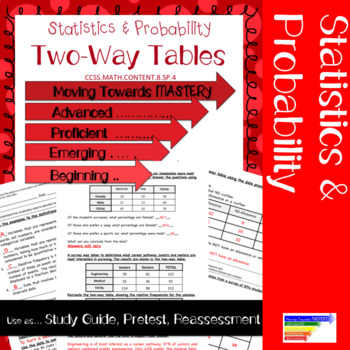
Two Way Frequency Tables Activity 8.SP.4 Pre Test, Study Guide, or Reassessment
The Two Way Frequency Tables Activity is great for a pre test before introducing the standard, study guide to prepare for an assessment, or as a reassessment. This resource will allow you to measure student understanding of two way frequency tables at various levels of mastery to identify at what level students are prior to instruction or after instruction. Levels of mastery are:→ Beginning → Emerging→ Proficient→ AdvancedEASY printing with answer keyNeed the TEST for this standard? Click the ti
Subjects:
Grades:
8th - 10th
CCSS:
Also included in: 8th Grade Common Core Statistics & Probability Assessments
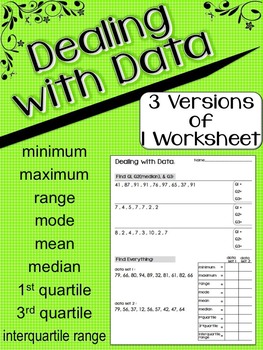
Dealing with Data - measures of dispersion and central tendency
This is a pdf file of a simple worksheet for practicing the basics - maximum, minimum, mean, median, mode, range, 1st quartile, 3rd quartile, and interquartile range.
This is an important scaffolding step because until students have a solid understanding of these concepts, they will not be ready to move on to more complex tasks with data like pulling pertinent values off of a table or creating box plots.
There are 3 versions of the same layout that can be seen in the thumbnail picture. Answer
Subjects:
Grades:
6th - 9th
Types:
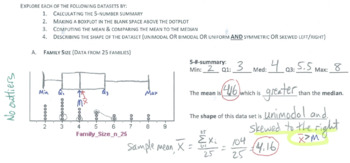
Statistics and Data Analysis: 5-number summary, box plots, and outliers
An introduction to data analysis, this 2-page handout (with answer KEY!) provides 6 datasets to analyze. Students compute the 5-number summary, make a box plot, describe the shape of a data set and relate the shape to the mean/median relationship, then finally go back through and check for outliers.
Subjects:
Grades:
9th - 12th
Types:
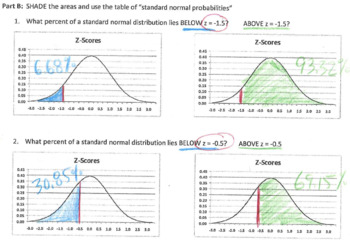
Statistics sketches: Z-scores and percentiles
Students will make a connection between z-scores and percentiles by shading the area under a bell curve (actually, 10 areas under 10 bell curves!). Finally, students will create a box plot under a standard normal distribution in order to make a strong connection between the unimodal symmetric normal distribution and its box plot.
Subjects:
Grades:
9th - 12th
Types:
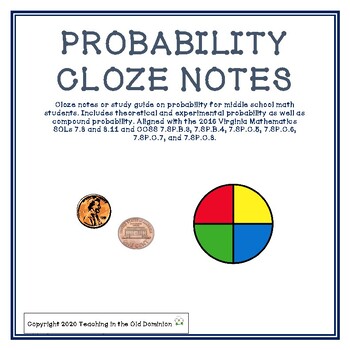
Probability Cloze Notes
Cloze notes and/or study guide on probability for middle school math students. Includes theoretical and experimental probability as well as compound probability. Aligned with the 2016 Virginia Mathematics SOLs 7.8 and 8.11 and CCSS 7.SP.B.3, 7.SP.B.4, 7.SP.C.5, 7.SP.C.6, 7.SP.C.7, and 7.SP.C.8.With clip art from:Maps of the World and Fun For Learning.
Subjects:
Grades:
6th - 9th
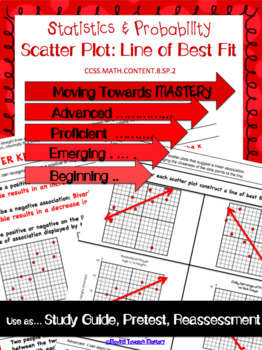
8.SP.2 Scatter Plots: Line of Best Fit Pre-test/ Study Guide/ Reassessment
This resource would be useful in the following ways:→ Pre-test before introducing the standard→ Study Guide to prepare for the assessment→ Reassessment This resource will allow you to measure student understanding of how to construct a line of best fit on a scatter plot at various levels of mastery to identify at what level students are prior to instruction or after instruction. Levels of mastery are:→ Beginning → Emerging→ Proficient→ AdvancedEASY printing with answer key-----------------------
Subjects:
Grades:
8th - 10th
CCSS:
Also included in: 8th Grade Common Core Statistics & Probability Assessments
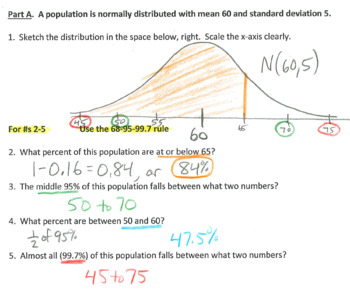
Statistics Quiz: the normal distribution
One practice quiz (with answer KEY!) and two forms of a "real quiz" (answer KEYs provided!) on the normal distribution. Students must sketch and label a bell curve, use the 68-95-99.7 rule, compute z-scores and use a z-table (commonly referred to as "Table A").
Subjects:
Grades:
9th - 12th
Types:
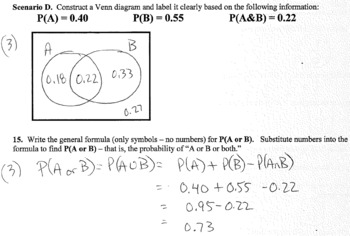
Statistics Quiz: Basic Probability (two versions)
Two versions of a quiz on basic probability concepts (answer KEYS provided). One quiz could be used as a practice/review. Includes sample space, independent events, mutually exclusive events, Venn diagrams, and the complement rule.
Subjects:
Grades:
9th - 12th
Types:
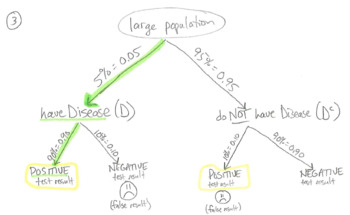
Probability Practice Packet (5 parts)
5-part probability practice packet (with answer KEY!). Students will practice the "rules and tools" of probability, to include the sample space, Venn diagrams, substitution into formulas, two-way tables, conditional probability, and tree diagrams.
Subjects:
Grades:
9th - 12th
Types:
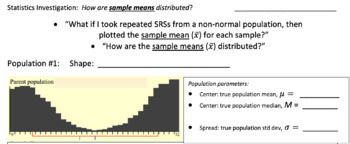
Statistics Investigation: the Central Limit Theorem:
This activity guides students as they investigate the wonderful website https://onlinestatbook.com/stat_sim/sampling_dist/. Through their observations, students can visualize the powerful and important fact known as the Central Limit Theorem (CLT).
Subjects:
Grades:
11th - 12th
Types:
Showing 1-24 of 33 results


