47 results
3rd grade graphing projects for Google Apps
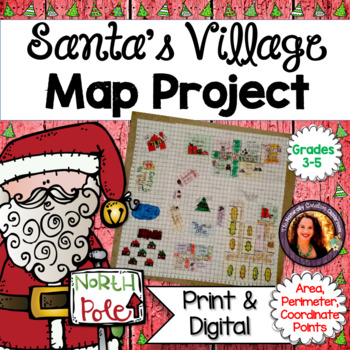
Christmas Math Activity Bundle | Area, Perimeter & Graph Map Project
Design the North Pole! Keep students engaged and learning during this busy time of year! This Christmas Math Activity project is a hands-on way to reinforce area, perimeter, factor pairs, map skills and finding and identifying coordinate points on a graph. For each item student are asked to record the arrays used, multiplication facts that helped them, the total area and the perimeter of each item. Some items are a simple rectangle, while other aspects, such as the reindeer barn have rooms wi
Grades:
3rd - 5th
Earth Day Math Project for Graphing and Data Interpretation
This resource is included in PDF format for printing and in Google Slides™️ format for digital learning. This makes it useable with Google Classroom™️.Are you looking for a way to reinforce graphing and data interpretation concepts in an engaging way that helps your students make connections? “Our Earth” is a real-life math project where students will complete eleven different graphing and data-related tasks. These activities can be used as a package, or in isolation. They work great as a math c
Subjects:
Grades:
2nd - 3rd
Also included in: Math Projects & Escape Rooms for Grades 2-3 | Bundle of Ten
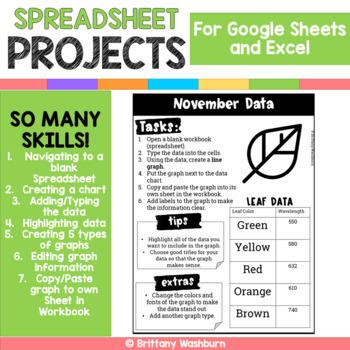
Google Sheets and Excel Spreadsheet Projects {12 Months}
12 projects with monthly themed data for students to practice creating spreadsheets in Google Sheets or Excel. There are 2 optional rubrics included too if you want to make this an assessment tool.SO MANY SKILLS!1. Navigating to a blank Spreadsheet2. Creating a chart3. Adding/Typing the data4. Highlighting data5. Creating 5 types of graphs6.Editing graph information7.Copy/Paste graph to own Sheet in Workbook1 for each month of the year (I stayed away from religious holidays)Works for any spreads
Grades:
2nd - 5th
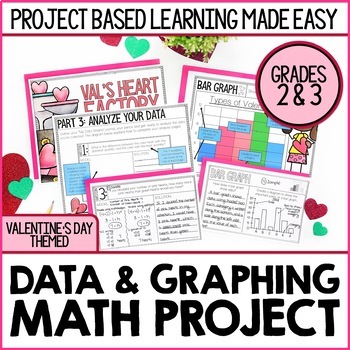
Valentine's Day Math Project | Conversation Hearts Graphing Lesson & Activity
This Valentine's Day-themed math project introduces your students to four methods for displaying data: Frequency TablesBar GraphsPictographsLine Plots Your students will record observations about each method for displaying data and compare/contrast methods for collecting data. Students will then use this knowledge to solve a problem for Val’s Heart Factory. Love this project idea, but planning to teach graphing at a different time of year? Sal's Sweet Factory will be a perfect fit for your class
Subjects:
Grades:
2nd - 3rd
Types:
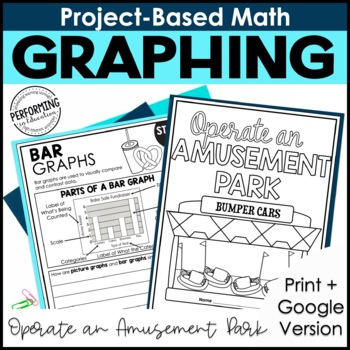
Math Project-Based Learning: Draw Picture Graphs & Bar Graphs | Data | 3rd Grade
This 5-day project-based math resource applies math concepts in a real-world scenario to teach students about drawing scaled picture graphs and scaled bar graphs. In this 5-day unit, students will apply graphing concepts to create scaled picture and bar graphs and answer questions about the data in the graphs. This graphing math project is engaging and authentic. Plus, it's available as both a digital and print resource.This project-based math resource covers concepts of rounding and is aligned
Subjects:
Grades:
3rd
Types:
CCSS:
Also included in: The Project-Based Math Library | 3rd Grade Math Project-Based Learning
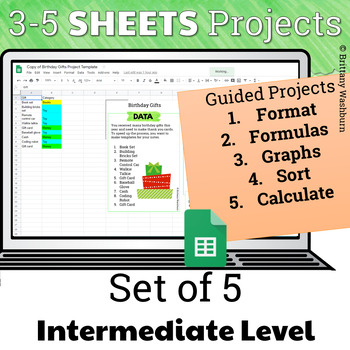
Google Sheets Projects for Grades 3-5
Guided Projects that Teach several skills in Google Sheets are the ideal way to build technology literacy for our youngest students. This set of 5 projects show students functions, formulas, formatting, graphing, calculations, and so much more so that by the time they get through the final project they could do it independently. Teacher Guide Includes:Standards AddressedLinks to the Google Sheets TemplatesHow to use the project templatesHow to use the printable PDF optionIncorporating the Spread
Grades:
3rd - 5th
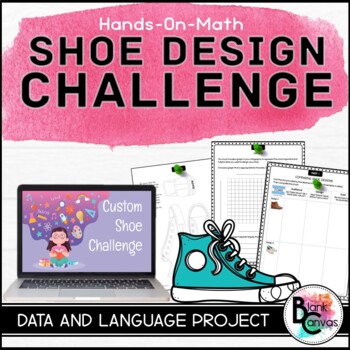
Shoe Design Challenge - A Data Management Project
Engage your students in data management with this fun and engaging cross-curricular shoe design challenge. This project based learning experience will have students collect data and analyze it to help design a shoe for a target audience. Once students have created their design, they will create an infographic about their shoe and persuade their audience on selecting the shoe. This organized 5-step process will be sure to encourage creativity. This project is versatile so you can adapt it to vari
Subjects:
Grades:
3rd - 8th
Types:
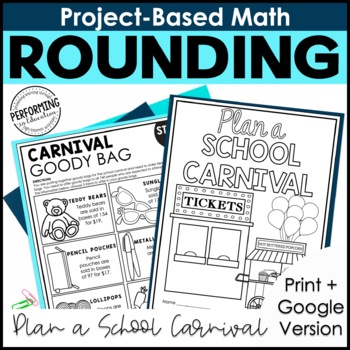
Math Project-Based Learning: Rounding to the Nearest 10 or 100 | Place Value 3rd
This 5-day project-based math resource applies math concepts in a real-world scenario to teach students about rounding to the nearest 10 and rounding to the nearest 100. In this 5-day unit, students will apply place value concepts to plan a school carnival. This rounding project is engaging and authentic. Plus, it's available as both a digital and print resource.This project-based math resource covers concepts of rounding and is aligned with the following 3rd Grade Math Common Core State Standar
Subjects:
Grades:
3rd
Types:
CCSS:
Also included in: The Project-Based Math Library | 3rd Grade Math Project-Based Learning
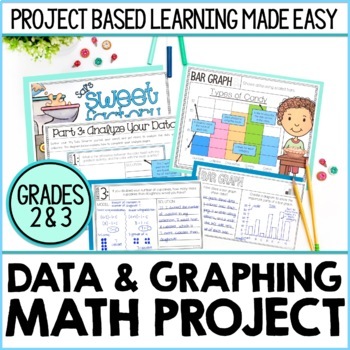
2nd & 3rd Grade Data and Graphing Math Project | Bar Graphs, Line Plots & More
This graphing math project introduces your students to four methods for displaying data: ★ Frequency Tables ★ Bar Graphs ★ Pictographs ★ Line Plots ★Your students will have the opportunity to record observations about each method for displaying data and compare/contrast methods for collecting data. They will then use this knowledge to solve a problem for Sal’s Sweet Factory. ***************************************************************************THE BIG PROBLEM YOUR STUDENTS WILL SOLVE:Sal's
Subjects:
Grades:
2nd - 3rd
Types:
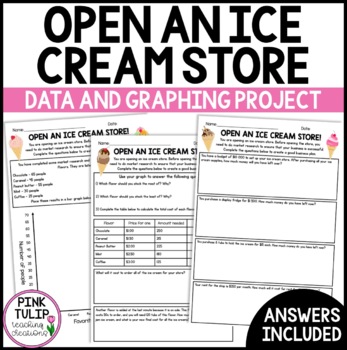
Open An Ice Cream Shop - Graphing and Data Math Activity
Open An Ice Cream Shop - Graphing and Data Math ActivityExtend understanding of graphing and data displays with this maths activity. This project is a great extension for early finishers, or the perfect assignment to implement at the end of a graphing and data module.This project encompasses a broad range of real-life mathematical skills, including budgeting and the four processes. It also requires students to research and price items for their store.This activity was designed to be used as a
Subjects:
Grades:
3rd - 6th
Types:
Also included in: Custom Order Resource Bundle #2
Run A Business Project Based Learning
This is a Project Based Learning activity that teaches students about running their very own business! It focuses on collaborative opportunities through hands-on experiences for students to engage in their learning. Students will create a business plan and follow through by running their business. Project Based Learning: Run A BusinessThis product includes differentiated activities, math skills, reading, research, writing, vocabulary, problem solving, aligned with Common Core, and extension acti
Show Me The Data! - Data Analysis Slide Project
Introducing a new Google Slide activity to have your students graph data using bar graphs, dot plots, pictographs, and frequency tables. In this activity, your students will generate their own survey question, record their date, and use the graph templates to show the data they collected. Enjoy!
Subjects:
Grades:
2nd - 5th
Types:
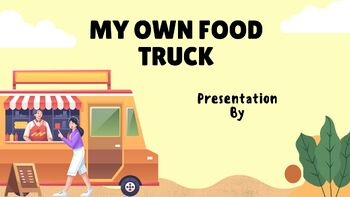
My Own Food Truck Graphing Project Based Learning
Allow your students to use their creativity to create their own food truck, sell to their classmates, and graph their data.Students will decide what to sell in their food truck then survey their classmates and collect data on a tally chart. They will create a bar graph using their data and answer questions about their graph.Project includes:links to videos I used during my lessonGoogle Slide deck to assign to students on Google Classroom printable tally sheet for students to collect data
Subjects:
Grades:
2nd - 4th
Also included in: GRAPHING BUNDLE
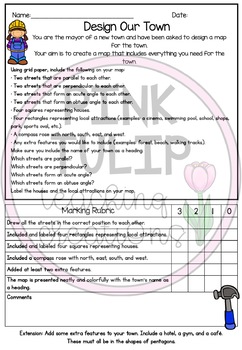
Town Design Numeracy Project - Coordinates and Mapping
**This project is included in my complete Cross Curriculum Math Assignments/Projects**Town Design Numeracy Project - Coordinates and MappingExtend learning of coordinates and mapping, with links to the real world. Aimed towards grades 3-5.Enrich and extend your students' understanding of coordinates, mapping, and shapes with this town design project. Students link their learning to real-life by designing a town using a range of shapes and coordinates. This activity is a great extension for early
Grades:
3rd - 6th
Types:
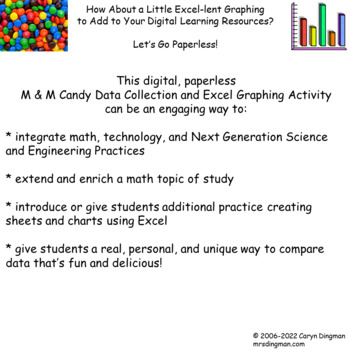
Excel Graphing M & M Candy with Digital Student Directions
Excel-lent spring or end of year project! This classroom-tested activity can be a perfect way to re-engage your students before or after state testing!Students will sort and count M & M candies, each using Excel to create a bar graph displaying/comparing the colors found in each individual small bag of M & M's. Each student will search and insert clipart or name-brand images of each candy color into each bar of his/her graph.Project file includes:* teacher notes/ classroom management sug
Evaporation Project
Students will use the scientific method process to complete an experiment about the evaporation rate of different liquids.Exciting and Engaging!Students will:Ask QuestionsForm a HypothesisFollow a ProcedureInterpret DataGraphDraw Conclusions
Subjects:
Grades:
3rd - 8th
Types:
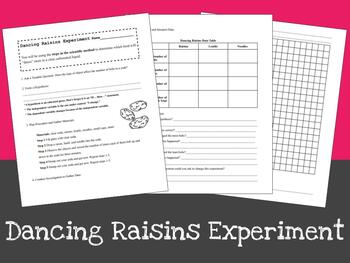
Dancing Raisins
Students will use the scientific method process to complete an experiment about gummy bearsExciting and Engaging!Students will:Ask QuestionsForm a HypothesisFollow a ProcedureInterpret DataGraphDraw Conclusions
Grades:
3rd - 8th
Types:
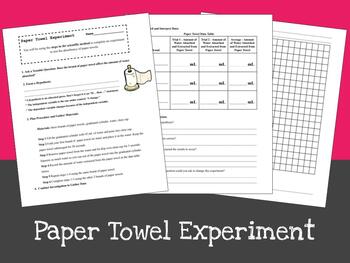
Paper Towel Experiment
Students will use the scientific method process to complete an experiment about the absorbency of paper towels.Exciting and Engaging!Students will:Ask QuestionsForm a HypothesisFollow a ProcedureInterpret DataGraphDraw Conclusions
Subjects:
Grades:
3rd - 8th
Types:
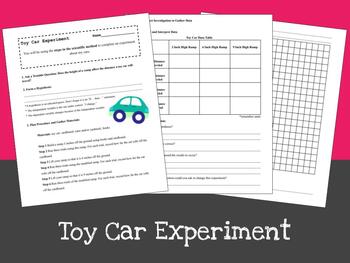
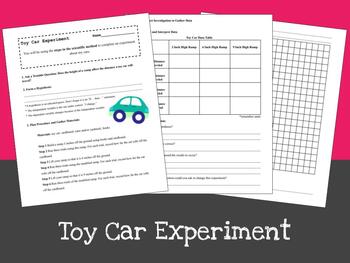
Toy Car Experiment
Students will use the scientific method process to complete an experiment about toy cars.Exciting and Engaging!Students will:Ask QuestionsForm a HypothesisFollow a ProcedureInterpret DataGraphDraw Conclusions
Subjects:
Grades:
3rd - 8th
Types:
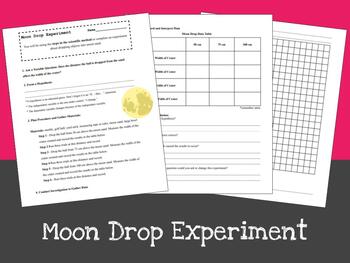
Moon Drop Experiment
Students will use the scientific method process to complete an experiment about indentions made in moon sand.Exciting and Engaging!Students will:Ask QuestionsForm a HypothesisFollow a ProcedureInterpret DataGraphDraw Conclusions
Grades:
3rd - 8th
Types:
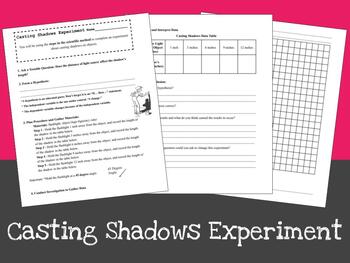
Casting Shadows Experiment
Students will use the scientific method process to complete an experiment about casting shadows.Exciting and Engaging!Students will:Ask QuestionsForm a HypothesisFollow a ProcedureInterpret DataGraphDraw Conclusions
Grades:
3rd - 8th
Types:
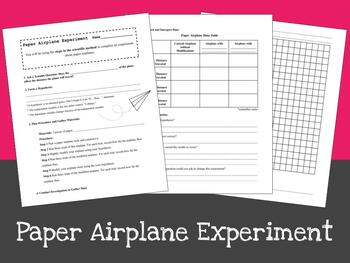
Paper Airplane Experiment
Students will use the scientific method process to complete an experiment about paper airplanes.Exciting and Engaging!Students will:Ask QuestionsForm a HypothesisFollow a ProcedureInterpret DataGraphDraw Conclusions
Subjects:
Grades:
3rd - 8th
Types:
NGSS:
3-5-ETS1-3
, 3-5-ETS1-2
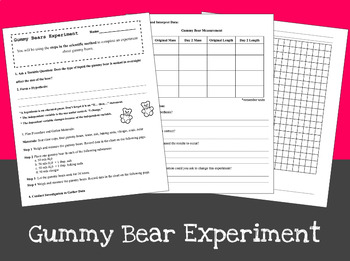
Gummy Bear Experiment
Students will use the scientific method process to complete an experiment about gummy bears.Exciting and Engaging!Students will:Ask QuestionsForm a HypothesisFollow a ProcedureInterpret Data GraphDraw Conclusions
Grades:
3rd - 8th
Types:
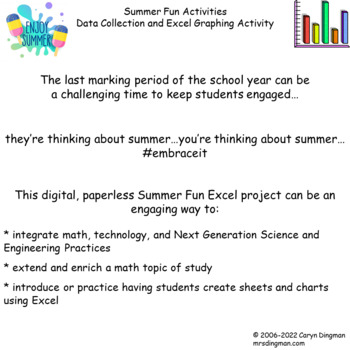
Excel Graphing Summer Fun with Digital Student Directions
The last marking period of the school year can be a challenging time to keep students engaged…they’re thinking about summer…you’re thinking about summer…#embraceitThis Summer Fun Excel project can be a perfect way to:* integrate technology* extend and enrich a math topic of study* introduce students to creating sheets and charts using ExcelProject file includes:* teacher notes/ classroom management suggestions* digital survey, using a Google Form, to collect summer activities data* digital stude
Subjects:
Grades:
3rd - 6th
Types:
Showing 1-24 of 47 results


