3 results
Applied math laboratories for Microsoft Excel

Finding PI Using Excel
Data is taken to find the value of Pi through the measurements of circumference and diameter. The data is inputted into Excel to create a table for finding PI. A graph is generated to find the slope which is also Pi.
Grades:
7th - 12th, Higher Education
Types:

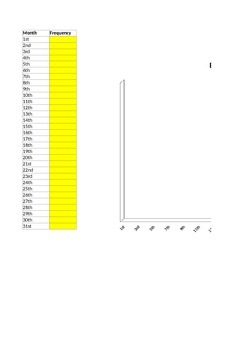
Birthday Frequency Graph - by Day of Month
An interactive Excel spreadsheet to graphically display the frequency of birthdays by day of the month. Simply fill in the yellow cells with the appropriate number and the chart will automatically update.
Subjects:
Grades:
1st - 5th
Types:

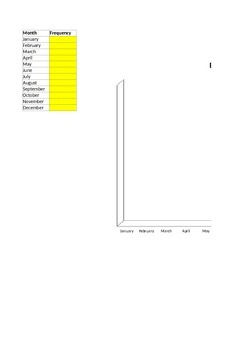
Birthday Frequency Graph - by Month of Year
An interactive Excel spreadsheet to graphically display the frequency of birthdays by month of the year. Simply fill in the yellow cells with the appropriate number and the chart will automatically update.
Subjects:
Grades:
K - 5th
Types:
Showing 1-3 of 3 results


