33 results
High school calculus laboratory pdfs
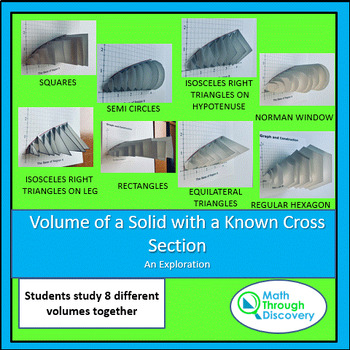
Volumes of Solids with Known Cross Sections - An Exploration in Calculus
One of the topics that is difficult for students to grasp is finding the volume of a solid with a known cross section. One reason is that students have difficulty with this topic is that they have difficulty drawing the solid. In this activity the students get to build eight different "solids.”This activity focuses on finding the volume of solids that are built on a two-dimensional surface when cross section cut perpendicular to a known shape. The activity uses the region bounded by the x-axis,
Grades:
10th - 12th, Higher Education
Types:
Also included in: Calculus - Volume using Known Cross Sections Bundle
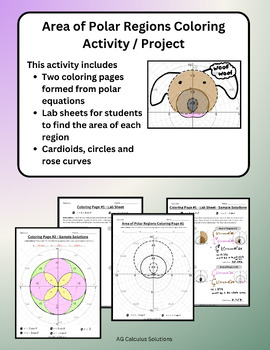
Area of Polar Regions Coloring Page Activity / Project Calculus II / BC
Help students explore area between polar curves using this coloring page activity. This activity can easily be turned into a project for students to complete on their own or an in-class activity. This activity covers AP Calculus BC Topics9.8 Find the Area of a Polar Region or the Area Bounded by a Single Polar Curve9.9 Finding the Area of the Region Bounded by Two Polar CurvesThis activity includes two interactive coloring pages and an extensive key that maps how to find the area of each region
Subjects:
Grades:
10th - 12th
Types:
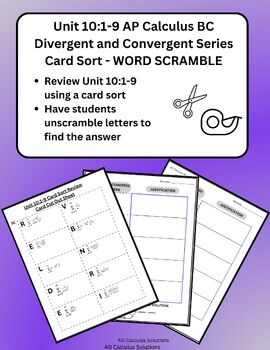
Divergent & Convergent Series Card Sort Word Scramble - 10:1-9 Review AP Calc BC
Help students review infinite series with the fun card sort word scramble activity. All questions in this word scramble activity are aligned to AP Calculus sections 10-1, 10-2, 10-3, 10-4, 10-5, 10-6, 10-7, 10-8, and 10-9. Students will work to determine if each infinite series is divergent or convergent and then work to unscramble the letters on each series to reveal two mystery words.
Subjects:
Grades:
10th - 12th
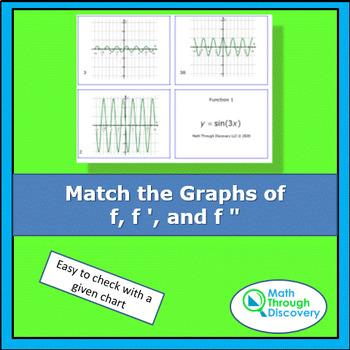
Calculus - Match the Graphs of f, f ', and f "
This set of 100 cards (25 sets of 4) can be duplicated on card stock and then cut apart for a great cooperative learning activity in Calculus. Duplicate the pages in the landscape mode so the cards are slightly larger. Each set of four cards includes:• a graph of a function, • a graph of a derivative of a function, • a graph of the second derivative of a function, and • an algebraic description of a function.Each of the four cards has been numbered with a random number between 1 and 75. A key
Grades:
10th - 12th, Higher Education
Types:
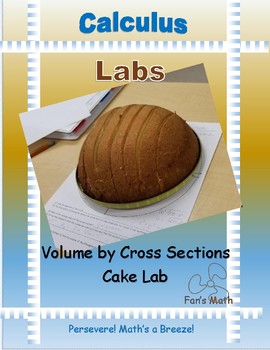
Calculus Lab 7-1: Volume by Cross Section Cake Lab
There are many ideas for helping students visualize volumes of solids by cross sections, but nothing gets the students’ attention more than food‼ This simple packet includes directions for making the hemisphere cake and a lab sheet for the students. The lab only takes about 20 minutes so there is plenty time to present the lesson with examples and culminate with the hemisphere cake.
Of course, the lab could be done with half of a ball of Styrofoam, but where’s the fun in that????
My students
Subjects:
Grades:
12th
Types:
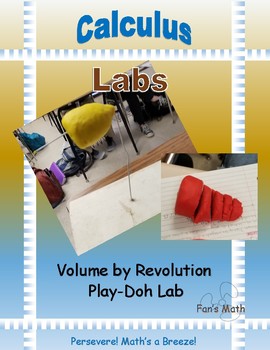
Calculus Lab 7-2: Volume by Revolution Play-Doh Discovery Lab
There are many ideas for helping students visualize volumes of solids by revolution, but seniors love to play with Play-Doh‼ This resource includes how to use Play-Doh to discover the formulas for Volumes of Revolution by Disks and Washers as well as how I incorporate the discovery in my lesson and the examples I use. Depending on how much time I have left in the year, I can teach disks and washers in the same 55 minute class or teach them individually on two different days.
My students encoun
Subjects:
Grades:
12th
Types:
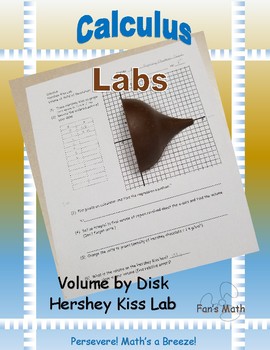
Calculus Lab 7-3: Volume by Disk Hershey Kiss Lab
There are many ideas for helping students visualize volumes of solids by revolution, but nothing gets the students’ attention more than food‼ This simple lab includes directions for cutting the Hershey Kiss and a lab sheet for the students. I use this lab to culminate the unit on volumes. It only takes about 20 minutes so there is plenty time to review the day before the test.
Of course, the lab could be done with one Hershey Kiss tracing the figure on each of their lab sheets, but then there
Subjects:
Grades:
12th
Types:
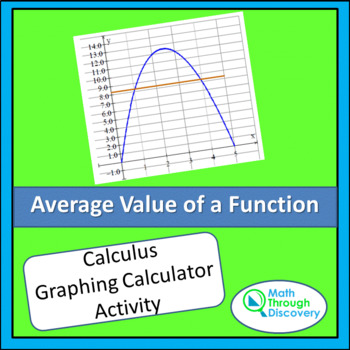
Calculus - Average Value of a Function - An Exploration
As part of the AP Calculus course description students need to understand what it means to find the average value of a function. This activity incorporates the graphing calculator to develop an understanding for the average value of a function. Students draw graph for four functions to view all the function values between two x values. Since students understand that they find an average for a set of numbers by dividing the sum of the numbers by the total number of numbers, this lesson begins by
Grades:
10th - 12th, Higher Education
Types:
Also included in: Calculus - Bundled Lessons on The Average Value of a Function
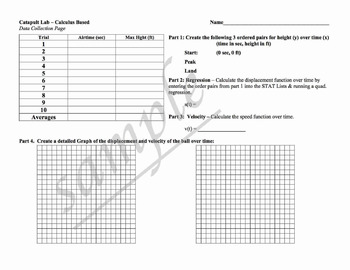
Polynomial Labs (Quadratics, Cubics, etc.) including Catapults!
This lab includes two versions of a catapult lab (calculus based and non-calculus based). Students work in groups to collect data on a ball launched using a catapult. Students create regression equations using a graphing calculator or spreadsheet.
Also included is a painted cubes lab that includes 4 types of functions.
Courses: algebra 1, algebra 2, pre-calculus, calculus
Here are links to my other algebra projects:
Click Here to see my project: Indirect Measurement Labs
Click Here to see
Subjects:
Grades:
8th - 12th, Higher Education, Adult Education
Types:
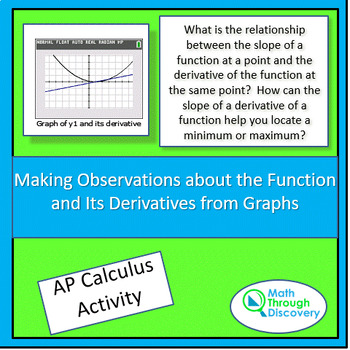
Calculus-Making Observations about the Function and Its Derivatives from Graphs
This discovery activity is made up of 5 part plus a closing question.Part I: Students graph a function and its derivative. From the two graphs students observe that when the graph of the derivative of y1 is positive the graph of y1 is increasing and that when the graph of the derivative of y1 is negative the graph of decreasing. Part II: In part I students studied a function with a minimum. In this part students will repeat the same observations but with a function that has a maximum. Part III:
Grades:
10th - 12th, Higher Education
Types:
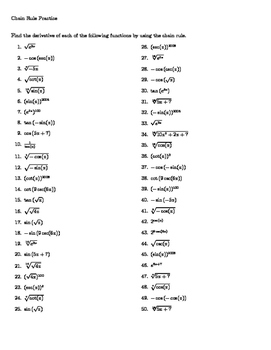
Chain Rule Practice Worksheet
** BE SURE TO CHECK OUT MY OTHER WORKSHEETS! **
- *50* Questions!
- *COMPLETE* Solutions!
If you want to move on to more complex mathematics, you need to get certain topics out of working memory. This is my goal in all of my worksheets - to help students learn a particular techniques or topics to the point where it's automatic and they don't have to think about it, so that they can achieve more on the advanced topics.
This is a worksheet that covers one topic - the chain rule in differe
Subjects:
Grades:
10th - 12th, Higher Education, Staff
Types:
Calculus - Continuity
This activity engages the students in understanding the three parts of the definition for a continuous function at a point by asking a series of questions about several functions.You also might be interested in the Activity Sheet on Continuity and the Intermediate Value Theorem that is available in my store. A recent buyer said "Thank you for providing this resource. I appreciate your time and investment in creating a helpful resource."
Subjects:
Grades:
11th - 12th, Higher Education
Types:
Also included in: Calculus - Continuity Bundle
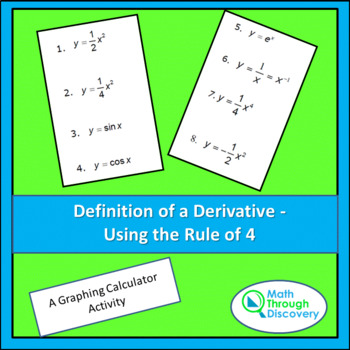
Calculus - Definition of a Derivative - Using the Rule of 4
This activity incorporates the graphing calculator to help students understand the definition of a derivative. Students in AP Calculus and Calculus should be studying the concepts in Calculus graphically, numerically, verbally and analytically ( which is also known as the rule of 4). This activity sheet will help develop the student’s conceptual understanding of the definition of a derivative in these four ways:• Students create graphs and tables of a function and a difference quotient. As th
Subjects:
Grades:
10th - 12th, Higher Education
Types:
Calculus - How Can One Graph Help Describe Another Graph?
This activity incorporates the graphing calculator to help students understand how the behavior of one graph can describe the behavior of another function. Three related equations are entered in y1, y2, and y3 in the graphing calculator. • The original function is entered in y1. • An expression that represents the derivative of y1 is entered in y2. • An expression that represents the derivative of y2 is entered in y3. After graphing y1, y2, and y3 in the same window, a series of questions a
Grades:
10th - 12th, Higher Education
Types:

Alg 1 - Exponential Growth - An Exploration on the Graphing Calculator
This class activity engages students in modeling exponential growth and decay using the RandInt command on the TI84 graphing calculator.
Subjects:
Grades:
10th - 12th
Types:
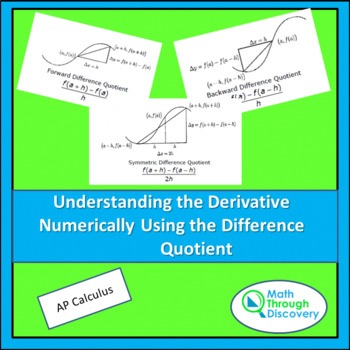
Calculus - Understanding The Derivative Numerically
This activity incorporates the TI84 and TI84C Graphing Calculator to study how the three difference quotients approach the same limit. Students write equations to match sets of table values as the limit of h approaches zero.
Subjects:
Grades:
10th - 12th, Higher Education
Types:
Also included in: Calculus - Understanding the Derivative Bundle
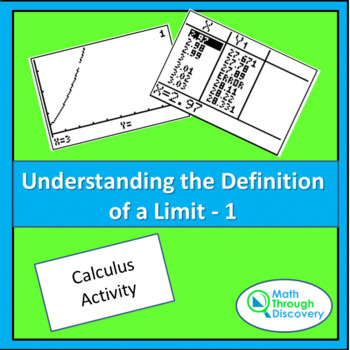
Calculus - UNDERSTANDING THE DEFINITION OF A LIMIT-1
Students often struggle to understand the formal definition of a limit. This activity sheet has the students build both tables and graphs to see what the definition is saying. In the tabular form, the students keep refining the table to be convinced that as long as they stay very close to a value of a on the x-axis all y values will stay in a close range of a particular number called a limit. The same idea is explored graphically by trying to keep all y values visible when given a particular
Subjects:
Grades:
11th - 12th, Higher Education
Types:
Also included in: Calculus - 3 BUNDLED LESSONS ON UNDERSTANDING THE DEFINITION OF A LIMIT

Calculus - Connecting Continuity with Differentiability
Through this activity students learn the connection between continuity and differentiability of a function. The activity uses either the TI84 or TI84C graphing calculator. Students should understand this concept for AP Calculus.You might also be interested in the Activity Sheet on Continuity and the Intermediate Value Theoremthat is available in my store.
Grades:
10th - 12th, Higher Education
Types:
Also included in: Calculus - Continuity Bundle
Calculus Lab 2-1: Parabolic Action of a Free-Falling Object
There is nothing better for understanding than real world applications. In this lab, the students will use a motion detector to find the parabolic graph in time vs distance of a ball thrown up and caught. They will find the regression equation for the parabola on their calculators, then answer questions dealing with average velocity, instantaneous velocity, acceleration and speed. This file contains helpful teacher hints for using a motion detector, student directions for the lab , and questions
Subjects:
Grades:
11th - 12th
Types:
Also included in: Calculus Unit Bundle 2A: Definition of Derivative
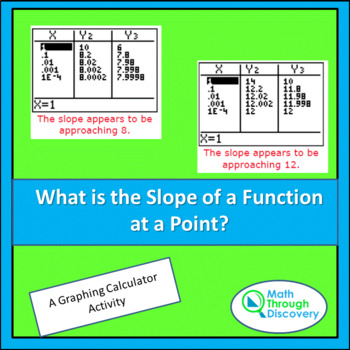
Calculus - What is the Slope of a Function at a Point?
This graphing calculator activity engages the students in using two difference quotients and table values to approximate the slope of a function at a point. Students first study y = 2x^2 at the point (1,2). Using the two difference quotients, students find that the slope is 4. The students then explore find the slope of the same function at x = 2, 3, -1, -2, and -3. They then conjecture what the slope will be at A = -4, +4, and 0. Student then move to studying the slope along y = x^3 y =
Subjects:
Grades:
11th - 12th, Higher Education
Types:
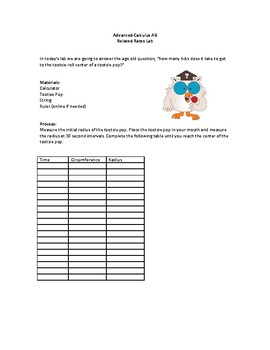
Related Rates - Tootsie Pop Lab
Students will measure the change in radius of a tootsie pop, then created a line of best fit to find dr/dt. Finally, students will find dv/dt and talk about when volume is changing the fastest.
Subjects:
Grades:
10th - 12th
Types:
Calculus - Understanding The Derivative Graphically Using Difference Quotients
Students can used their graphing calculators to build an understanding for the formal definition of a derivative (limit as h approaches zero of (f(x+h)-f(x))/h). Students will set up the forward difference quotient, the backward difference quotient, and the symmetric difference quotient approaching the same limit. Then students will let h equal 1, 0.1, 0.01, and 0.001) to notice that all the difference quotients approach one function. The function they are all approaching will be called t
Subjects:
Grades:
10th - 12th, Higher Education
Types:
Also included in: Calculus - Understanding the Derivative Bundle
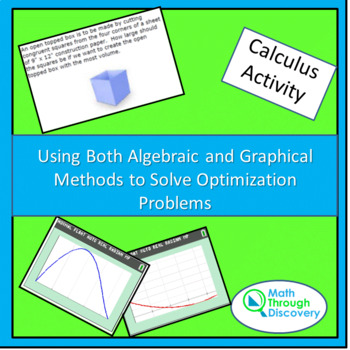
Calculus - Using Algebraic and Graphical Methods to Solve Optimization Problems
This activity illustrates for calculus students how they can solve optimization problems using algebraic and graphical methods. Two examples illustrate step by step procedures that can be followed to solve most optimization problems. Both analytical and graphical approaches are used to study the rate of change. After illustrating how two examples can be solved, five additional practice problems with solutions are provided for students to practice.Please check out the Activity Sheet on Optim
Grades:
11th - 12th, Higher Education
Types:
Also included in: Calculus - Optimization Bundle
Pre-Calculus - Maximizing the Volume of a Cone
This hands-on activity engages the students in constructing a cone from a circle,collecting data on the height and radius of the cone, creating a scatterplot, fitting a curve to the data and then estimating the maximum volume of the cone. Many students are surprised that the scatterplot indicates that the volume first slowly increases and then after a maximum volume occurs the volume quickly decreases. By working with a physical model helps students observe how the height, radius, and volume a
Grades:
11th - 12th, Higher Education
Types:
Showing 1-24 of 33 results


