Calculus - Average Value of a Function - An Exploration
Also included in
- This bundle of lessons includes both an activity sheet and a powerpoint lesson that are coordinated. As part of the AP Calculus course description students need to understand what it means to find the average value of a function. This activity incorporates the graphing calculator to develop an undePrice $4.80Original Price $6.00Save $1.20
Description
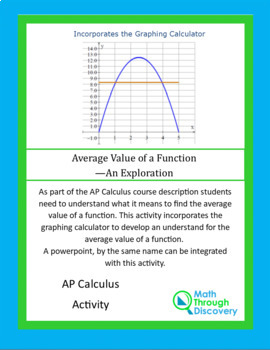
As part of the AP Calculus course description students need to understand what it means to find the average value of a function. This activity incorporates the graphing calculator to develop an understanding for the average value of a function.
Students draw graph for four functions to view all the function values between two x values. Since students understand that they find an average for a set of numbers by dividing the sum of the numbers by the total number of numbers, this lesson begins by averaging a finite number of functions values. This is extended to finding the area of the bounded region and dividing that area by the difference between the two x-value limits to find the average value that the function takes on.
The four functions studied are
• y = 2x + 5 between x = 0 and x = 5
• y = 0.5x^2 between x = 0 and x = 5
• y = - 2x^2 + 10x between x = 0 and x = 5 and
• The piecewise function y = 1.5x^2 between x = 0 and x = 5 and y = -2x + 10 between x = 2 and x = 5.
By the end of the lesson or activity students are writing that the average value of a function is found by integrating the function between the two x values and then dividing that integral by the difference between the two x values.
Students are then given five exercises to complete. Two involve simple nonlinear functions, one is based only on a graph of a piecewise function, and then two other problems are based on algebraic descriptions of two functions.
A complete set of solutions is included.
A powerpoint, by the same name can be integrated with this activity.
Comments from Buyers:
• Thank you
• This is a good exploration that guides the students right to the graphical meaning of average value.
• Thank you - very helpful.


