114 results
11th grade algebra laboratories
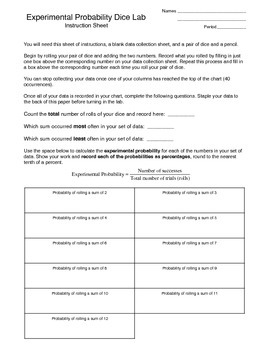
Experimental Probability Activity (dice lab)
In this activity students work with a partner to roll a pair of dice (many times) and record the sum of the dice in a data collection sheet. Once the data has been collected the students are walked through the process of calculating the experimental probability for each sum and then the theoretical probability for each sum and are asked questions about the differences they find between the values. Students also make a bar graph using the percentages for theoretical probability and can visually s
Subjects:
Grades:
7th - 11th
Types:
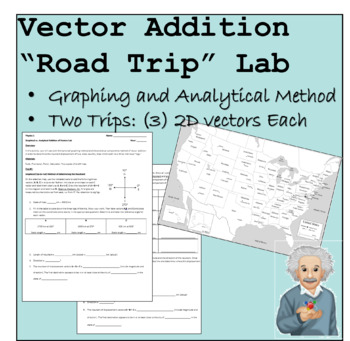
Vector Addition "Road Trip" Lab Activity
Overview:In this activity, students will use both the tip-to-tail graphing method and the analytical components method of vector addition in order to determine the resultant displacement of two, cross-country, trips which each have three individual "legs."Materials:Ruler, Protractor, Pencil, Calculator, Handout
Subjects:
Grades:
10th - 12th
Types:
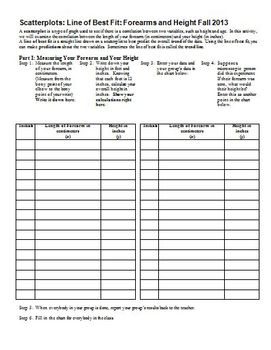
Scatterplots Linear Regression Line of Best Fit Forearms & Height (Editable)
After teaching my students about scatterplots, correlation, and the line of best fit, I take a day for them to do a hands-on lab, in which they measure their height (in inches) and their forearm length (from the tip of their elbow, to the bony point on their wrist), and we plot the class data, write the equation of the line of best fit, and then use the equation generated both forwards and backwards. They will need 45 minutes to an hour to do this in class.
I have found that if the students br
Subjects:
Grades:
7th - 12th
Types:
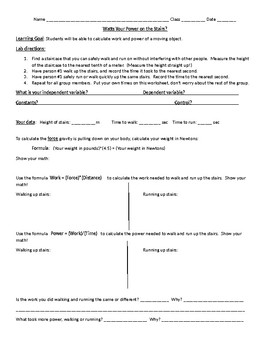
"Watts Your Power on the Stairs?" Quick lab calculating work and power
This lab activity has students compare the work and power they have while walking and running up a flight of stairs. This is a pretty common lab activity, but I just could not find a student handout that had exactly what I was looking for. So, I made this one and hope you will try it out and let me know how it goes!
Students will have to measure the distance and time of each trial, and use the work and power formulas. They will also identify the independent variable, dependent variable, cons
Subjects:
Grades:
6th - 12th
Types:

Quadratic Functions - Introduction to graphing with Technology
I introduce my students to graphing quadratic functions using technology with this self made worksheet. My students like spending time in the computer lab, it gives them independence to try something new and they enjoy seeing the graphs be formed on the screen as soon as they type in an equation and they love getting out of the classroom! It is a lot more fun then graphing with paper and pencil.
I consider this work as a project because it is work done outside a classroom. It requires a com
Subjects:
Grades:
7th - 11th
Types:
CCSS:

Webquest Investigation - Slope of a Line
Using a free online graphing calculator, students explore relationships between linear equations, their graphs, and the slopes of the lines. By the end of this investigation, students will discover relationships between parallel lines, perpendicular lines, and their slopes. Enjoy!
Subjects:
Grades:
7th - 11th, Adult Education
Types:
Linear Equations in Action
In this experiment, your students will dive into the world of hands-on mathematics, making real predictions that they can put to the test. It's not just about numbers on paper; it's about using math to solve real-world problems and answer the questions that matter. With this assignment, you'll empower your students to:Record Data: They'll collect real-world data through multiple trials, refining their observation and recording skills.Graph Like Pros: They'll create scatter plots that visually re
Subjects:
Grades:
8th - 12th
Types:
Quadratic Function Activity About Your Dental Arch
Through this activity students will discover properties of parabolas while comparing the parabola they all carry around with them every day - their dental arch. Students will brainstorm ways to measure a dental arch and ultimately take an "impression" of their arch by taking a bite out of a slice of bread. Then they will trace their arch onto a graph, use the graph to generate a table of values, and then use the table to plug into an equation for the most "perfect" dental arch. Students love
Subjects:
Grades:
8th - 12th, Higher Education, Adult Education
Types:
Also included in: Quadratic Functions Activities Bundle
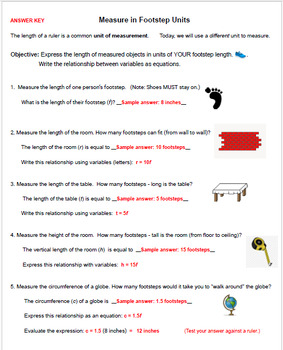
Activity: Measuring in Units of My Foot - Writing Simple Equations
In this activity, students use measuring skills & write one-step equations. An answer key is provided. Students measure the length of their foot (in inches) and use it as a base unit for expressing the length of different objects. Students use the variable "f" and a coefficient (number of footsteps) to write a simple equation for the length of an object. You can add the challenge of having students evaluate the expression. This measuring activity can be used in a math or numeracy class, as w
Subjects:
Grades:
4th - 12th, Higher Education, Adult Education, Staff
Types:
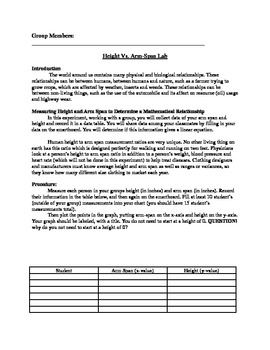
Height Vs. Arm Span Lab: Using real life data and linear regression
Students use their arm-span and heights to create a scatter plot and linear regression to find the equation for a line.
Subjects:
Grades:
8th - 12th
Types:

GONE WITH THE WIND - A DESIGN BRIEF
This challenge is one of several associated with wheeled vehicles and the variables that affect vehicle performance. It would be to the students’ advantage if they had some prior construction experience with other projects, preferably with other wheeled vehicles. These other vehicles could have been powered by rubber bands, electricity, solar energy, air pressure, tension springs or gravity. This challenge expects the vehicle to be wind powered.
Subjects:
Grades:
7th - 11th
Types:
CCSS:
NGSS:
MS-ETS1-4
, HS-PS2-2
, MS-PS2-2
, HS-PS2-1
, MS-ETS1-1
...
Also included in: FORCE AND MOTION DESIGN BRIEFS
ROLL A RAMA - A DESIGN BRIEF
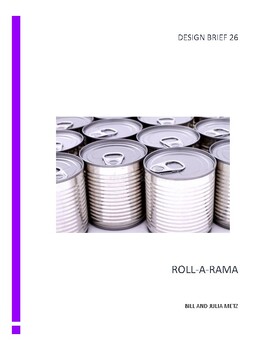
This design brief could be used as a general design challenge or as a discrepant event for introducing the concept of inertia and Newton’s laws. In any case, students will need to explore the rolling characteristics of each of the cans of soup as well as the other variables that affect their relative speeds. Given the mathematics background of the students, the formula V =d/t could be used to compute the speed of each can (V = velocity, d = distance and t = time).
Subjects:
Grades:
7th - 11th
Types:
NGSS:
HS-ETS1-2
, MS-PS2-4
, MS-ETS1-4
, MS-PS2-2
, MS-ETS1-1
...
Also included in: FORCE AND MOTION DESIGN BRIEFS
GRAVITY: how much would you weigh
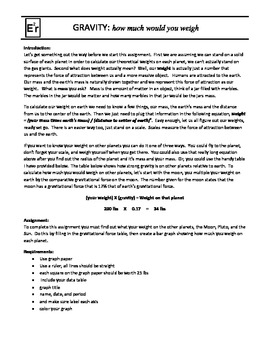
This is a nice little activity for helping your students get to understand how gravity works. In this activity students will be required to calculate how much they weigh on other planets in our solar system. Once they know how much they would weigh, they are required to create a bar graph showing how much they weigh on each planet in graphical form.
This covers common core standard #7, integration of knowledge and ideas.
Subjects:
Grades:
5th - 12th
Types:
Systems of Linear Equations - Solving by Graphing with Technology
This is a project I use in my Algebra 2 Honors classroom to help my students practice graphing a system of linear equations.. The questions for each graph are as follows:
Classify the System _______________________
Solution (s) ? if yes, write solution, otherwise, write No Solution_________________________________________
Y-intercept _____________for first line
Y-intercept _____________for second line
This project takes about 1 -2 periods in the computer lab using graphing software or a gra
Subjects:
Grades:
8th - 12th
Types:
CCSS:

Which Is More Cost Effective? Solar Heat or Oil Heat. The Math in Action Series.
Newly revised and improved. As heating costs and power outages seem to be on the rise, many Americans are looking into alternative energy resources. The use of oil for home heating has many people looking into solar energy especially those living in the Southern sections of the United States where the sun is stronger. This activity will ask your students to look at some basic costs for installing and heating their homes with oil and solar energy from a mathematical view point. Topics co
Subjects:
Grades:
7th - 11th, Adult Education
Types:
Scatterplots: Linear Regression Line of Best Fit:Forearms and Height (Editable)
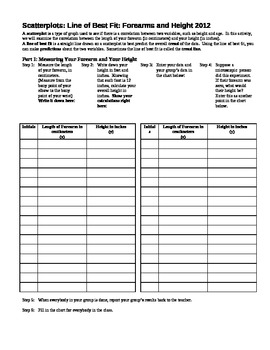
After teaching my students about scatterplots, correlation, and the line of best fit, I take a day for them to do a hands-on lab, in which they measure their height (in inches) and their forearm length (from the tip of their elbow, to the bony point on their wrist), and we plot the class data, write the equation of the line of best fit, and then use the equation generated both forwards and backwards. They will need 45 minutes to an hour to do this in class.
Some years, the data have very littl
Subjects:
Grades:
7th - 12th
Types:
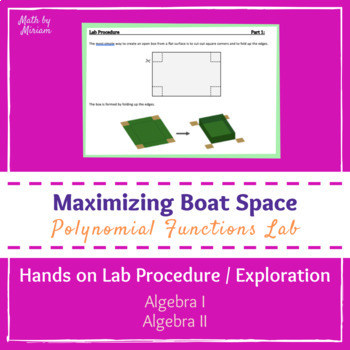
Introduction to Polynomials Functions Lab (PBL PrBL Activity)
This lab is meant to launch your Polynomials unit in an Algebra 2 class or an Honors Algebra 1 class. This is a perfect addition to any PrBL/PBL run class. Before teaching students anything, let them explore an application for a polynomial (cubic) function and derive a function themselves. The pre-lab directs students to build an open-face-box out of a single piece of paper with the largest volume possible in any way they choose (do not give them any further directions!). At the end of the pre-l
Subjects:
Grades:
9th - 11th
Types:
CCSS:
Also included in: Polynomial Functions Resource Bundle (PrBL PBL Unit)
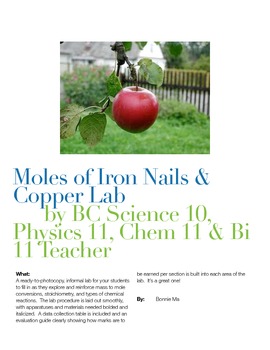
Moles of Iron Nails & Copper Lab
A ready-to-photocopy (but you receive an editable Word document as part of the Zip file), informal lab for your students to fill in as they explore and reinforce mass to mole conversions, stoichiometry, and types of chemical reactions. The lab procedure is laid out smoothly, with apparatuses and materials needed bolded and italicized*. A data collection table is included and an evaluation guide clearly showing how marks are earned per section is built into each area of the lab. It's a popular
Subjects:
Grades:
8th - 12th
Types:
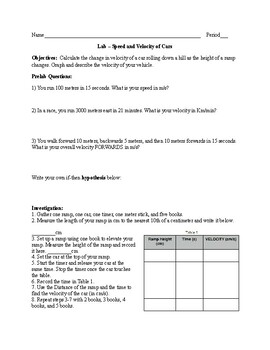
LAB Integrated Chemistry & Physics: Speed & Velocity of Cars - with graphing
Get your students engaged with physics by measuring, graphing and playing with cars! Students will determine the starting point & ending points, taking in data and graphing results.Materials: (per group)one ramp, one car, one timer, one meter stick, and five books.
Subjects:
Grades:
7th - 12th
Types:
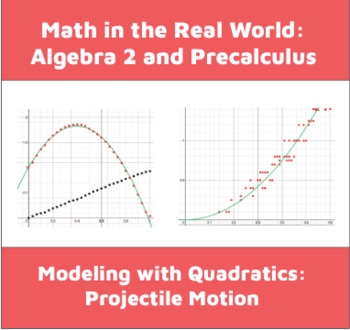
Quadratic Projectile Motion Lab with Data Set
In this activity, students analyze two different data sets that describe how projectiles fly through the air. The first describes the flight path of a thrown ball and the second describes the distance traveled by a ball dropped off a building over time. Using desmos.com, students fit linear and quadratic models to discover which quantities are related linearly (time and horizontal distance traveled) and which are related quadratically (time and vertical distance traveled.) They are asked to inte
Subjects:
Grades:
8th - 12th
CCSS:
Linear Equations Graphing with Technology
This is a project I use in my Algebra classroom to help my students practice graphing linear equations given in standard form using technology such as Geogebra, Desmos calculator or a graphing calculator.
The topics included are finding the following information from the different graphs:
Slope = ___________
X-intercept ________
Y-Intercept _______
Students are also required to write the slope intercept form.
A reflection is required at the end of the project in part to get some fe
Subjects:
Grades:
7th - 12th
Types:
CCSS:
How Much for Those Fries? The Math in Action Series.
Ever wonder how the price at a "Fast Food" restaurant may be determined. This activity may just answer that question for you. The application of mathematical theory has always been the "when will I ever use this Real Life" attitude from our students. I created this lesson to reinforce the theory of graphing data, calculating an equation of best fit, and formulating a conclusion. Each student will be able to see the usefulness of mathematics in a Real World setting. Common core stand
Subjects:
Grades:
5th - 11th, Adult Education
Types:
Surface Area and Volume lab (Editable)
I've taught my students the formulas for the surface areas and volumes of prisms, cylinders, and cones for a long time, and yet when they are asked to apply these formulas to everyday objects (cereal boxes, soup cans, printer cartridge packages, etc.), they seem to see the formulas as alien pieces of information.
I created this hands-on lab to help them with these concepts in a physical, hands-on way. This is a challenging activity for my students, sometimes because I find a few students who d
Grades:
9th - 11th
Types:
Math Lab An Algebra Review Via Hands-on Glider Investigation
Please join me in my enthusiasm for Math Lab Investigating Gliders!The lab is a two day event that covers and reviews multiple concepts covered in Algebra I, semesters I and II* It is outstanding for bringing concepts back to students prior to finals and for assisting them in applying mathematics to real life situations.* This 50 page investigation requires the student to address the relationship between the wing-span of a glider and the distance that it can fly.* On day one, students work in
Subjects:
Grades:
7th - 12th, Higher Education, Adult Education
Types:
Showing 1-24 of 114 results


