12 results
3rd grade statistics laboratory activboard activities
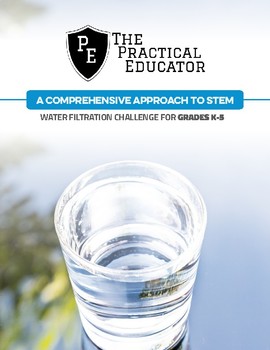
Water Filtration
Students are challenged to filter contaminated water for safe consumption using their own designs. 3D print and non-3D print options included. Students will also experience a complete engineering design process, collect and analyze data, and will share their results and finally reflect on their experience. Teacher and student instructions included. Developed by a team of engineers and teachers.
Subjects:
Grades:
PreK - 5th
Types:
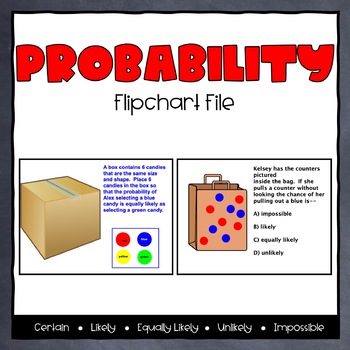
Probability ActivInspire Flipchart
This flipchart has 33 slides that have various types of practice with understanding probability. This flipchart introduces the concept of probability as chance and defines the 5 main descriptor words associated with probability (certain, likely, equally likely, unlikely, and impossible). It reinforces the concepts with examples. It also reviews the probability words and has several multi-step, technology-enhanced examples for student practice.The flipchart is designed for whole-group but coul
Subjects:
Grades:
2nd - 4th
Types:
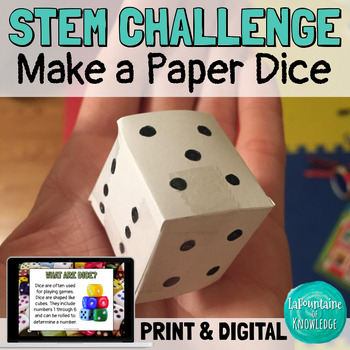
STEM Challenge Make a Paper Dice Geometry Lab Experiment PRINT and DIGITAL
In this STEM challenge, students create and test a paper die. They learn about dice and how their cube shape allows them to land on random numbers each time they are rolled. This hands on science lab activity incorporates geometry (3D shapes) and probability with engineering and design. This resource includes: teacher directions, discussion questions, and extension activitiesbackground information about dice and how they workan introduction to the challenge to get students starteda student respo
Subjects:
Grades:
3rd - 6th
Types:
NGSS:
3-5-ETS1-3
, 3-5-ETS1-1
, 3-5-ETS1-2
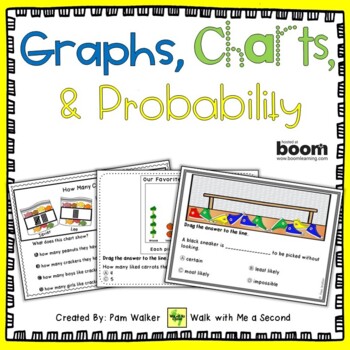
Graphing and Data with Boom Cards
This deck of 30 slides focuses on practice for the reading of charts, graphs, and data with six different presentations of data. This type of reading can be as challenging as text reading without practice.The click-to-answer plus drag-and-drop functions are easy to use for young learners. Like all Boom Cards, the answers are self-checking, so students get immediate feedback. The graph topics are engaging, too. Great for large or small groups, follow-up to lessons, distributive practice, independ
Subjects:
Grades:
1st - 3rd
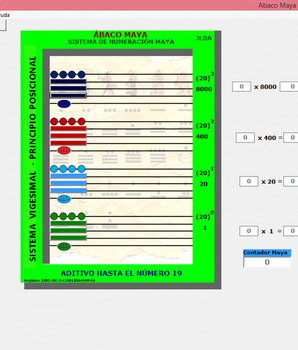
Ábaco Maya Software Interactivo -- Maya Abacus Interactive Software
El sistema de numeración Maya era vigesimal, basado en el número 20, en vez de la base 10 usada actualmente.En este último sistema hay diez cifras diferentes, 0, 1, 2, 3, 4, 5, 6, 7, 8 y 9 que se usan para representar cualquier número como potencias de la base del sistema, el número 10. Por ejemplo, el número 258 significa 2 x 10² + 5 x 101 + 8 x 100, es decir, dos centenas más cinco decenas más 8 unidades.English description:The Maya numbering system was vigesimal, based on the number 20, inste
Subjects:
Grades:
PreK - 3rd
Types:
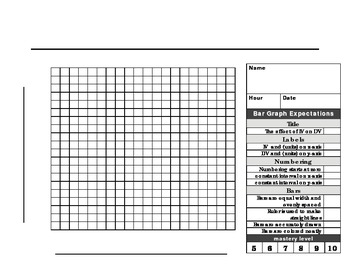
Bar Graph paper and rubric
This 20 X 20 graph paper with rubric is made for a beginner scientist to make a the perfect BAR graph. The checklist format makes it easy for students to know what is expected when graphing. Enjoy!
Subjects:
Grades:
1st - 12th, Higher Education, Adult Education
Types:
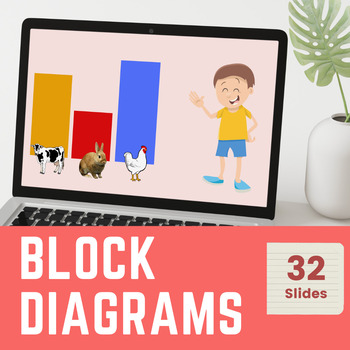
First Grade Bar Graph Fun: Interactive Digital Activities and Worksheets
First Grade Bar Graph Fun: Interactive Digital Activities and WorksheetsTake your first grader's data analysis skills to the next level with our engaging bar graphs digital activities. This no-prep math resource pack includes a collection of interactive activities and printable worksheets designed to introduce young learners to the concept of bar graphs. Your child will learn to read, interpret, and create bar graphs while having fun. Perfect for use in the classroom or at home, these activities
Subjects:
Grades:
1st - 3rd
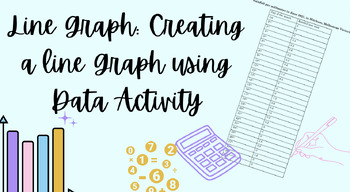
Line Graphs: Temperature and Rainfall Statistics Activity
An easy to read math lesson activity for your students to think creatively about data sets and create visual representations of real life data! Students will consider what different types of graphs that could work for these data sets, then create a graph that creates comparisons between temperature and rainfall. A great activity to solidify student understanding of graphs and data sets.
Subjects:
Grades:
3rd - 7th
Christmas stickers book(100 sticker )christmas activities
Christmas sticker book is the perfect craft for kids to get together and spend time together, teaching them about the true meaning of Christmas. This is a fun activity that is great for Christmas parties, family gatherings, and more. Kids will love this activity.
Grades:
PreK - 5th
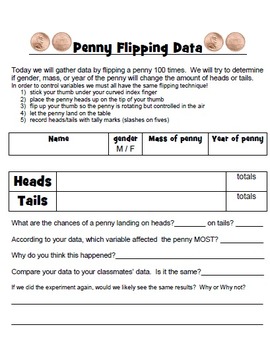
Flipping Pennies to Gather Raw Data
This record sheet will help your students gather raw data in the form of heads or tails. Use this data to look for patterns and then add up the class data to compare to. Discussion topics include percentages, chance, and cause/effect relationships.
Subjects:
Grades:
2nd - 9th
Types:
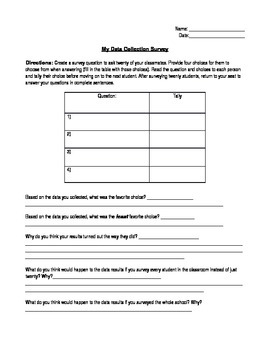
Data Collection Survey
This is a short survey where students are in charge of coming up with a question and surveying their classmates. They fill in the data as they collect it and analyze the data by answer questions at the end. It would be great at the beginning of the scientific method unit.
Subjects:
Grades:
3rd - 5th
Types:
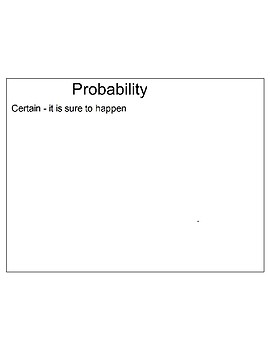
Probability Notes
Flip Cart Lesson for Notes on Probability.
Terms include:
Certain, Impossible, Likely, and unlikely
Includes review questions
Subjects:
Grades:
3rd - 4th
Types:
Showing 1-12 of 12 results


