Weather for 3rd Graders | STEAM Choice Board
- Zip
Also included in
- Have a one-stop location for various STEAM resources for third grade students to explore NGSS topics further.Students can choose out of the 8 resources and activities provided to deepen their learning.While not designed to be the core lesson for teaching, this is a standards-based, extension resourcPrice $9.50Original Price $12.00Save $2.50
Description
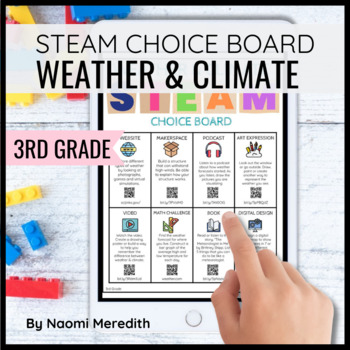
Have a one-stop location for various STEAM resources for third grade students to explore weather & climate further.
Students can choose out of the 8 resources and activities provided to deepen their learning.
While not designed to be the core lesson for teaching, this is a standards-based, extension resource that can be used alongside existing units.
---------------------------------------------
Digital & Printable choice board with clickable links, QR codes and shortened-links to be accessible for multiple uses. Researched links for:
- Website
- Makerspace challenge
- Podcast episode
- Art expression
- Short video
- Math challenge
- Related book
- Digital design
One page option for each of the challenges on the board to help teach and focus on one at a time. Also works great for station rotations!
---------------------------------------------
What this board works great for:
- Content-specific fast finisher
- Sub plans
- Extension work
- Homework alternative
- School break exploration
---------------------------------------------
Next Generation Science Standards (NGSS):
3-ESS2-1, 3-ESS2-2, 3-ESS3-1
Common Core State Standards:
RI.3.1, W.3.8, 3.MD.B.3
Mathematical Practices
MP.4: Model with mathematics.
ISTE Standards for Students
Knowledge Constructor
---------------------------------------------
How you will receive this product:
Various digital file types to meet your sharing needs
- PDF (non-editable, various sizes)
- Google Slides link
- PowerPoint file
- Seesaw activity
All Seesaw files are pre-loaded into activities. Upon purchase, you'll get the share link to copy & edit and add to your Seesaw Activity library, then assign to students. I saved you A LOT of steps!
How to assign digital versions to students:
- Google Slides pair perfectly with Google Classroom. Once you click the button, it will automatically make a copy for each student
- PowerPoint works well with Microsoft OneDrive users. Share with students within Microsoft Teams
- Seesaw Activities can be assigned to students and automatically make a copy.
---------------------------------------------
When you purchase a product from my store, a portion of the proceeds will be donated to classrooms in need of technology to enhance their students’ learning experience.
===========================================
Want to try standards-based STEM lessons that use the Engineering Design Process? Click HERE to check them out!
===========================================
Connect with me for more inspiration!
Naomi Meredith
Navigating STEM & tech in the K-5 classroom.
Click here to be updated when new products are posted.
Instagram: @naomimeredith_
Host of The Elementary STEM Coach Podcast
Questions? Email me: contactnaomimeredith@gmail.com


