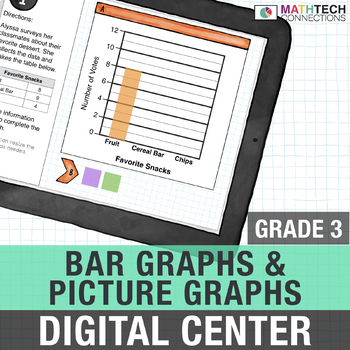
Bar Graphs & Picture Graphs 3rd Grade Paperless Test Prep Math Center | 3.MD.3
- Zip
- Google Apps™

What educators are saying
Also included in
- These interactive, digital math slides are review ALL third grade math standards. Prepare students for end of year testing without the ink and wasted paper! Students love the interactive moveable pieces and become comfortable with online testing.★ SAVE $37.50 when you purchase this Complete Bundle★APrice $50.00Original Price $87.50Save $37.50
- If you have access to Google Classroom, this Third Grade Digital Math Bundle will save you time and make math fun! This bundle includes math centers, spiral review, and assessments made specifically for use with Google Classroom.What's included?- Google Slides: Interactive slides that cover all thirPrice $71.73Original Price $143.46Save $71.73
Description
This paperless resource is specifically made for third grade students to review common core standard 3.MD.3 - I can draw a scaled picture graph and a scaled bar graph to represent a data set with several categories. I can use scaled graphs to solve one- and two-step problems.
★ What's Included?★
- Links to download the Google Slides ™
- Directions on how to assign on Google Classroom ™
- Practice 1 - 10 slides
- Practice 2 - 10 slides
- PowerPoint Version
- Answer Key
Please click PREVIEW for more details
Purchase the BUNDLE and Save $$
Who should purchase this resource?
- Teachers who want students to become comfortable with interacting with digital resources
- Teachers who want to print less!
- Teachers who want to make math centers less complicated
- Teachers looking for resources that are standards aligned
Please note, this resource covers standard: 3.MD.3
Learning Goal: I can draw a scaled picture graph and a scaled bar graph to represent a data set with several categories. I can use scaled graphs to solve one- and two-step problems. The only editable part of this file is the standard, so you can change the standard to match the wording of your state. You can also delete slides and add your own slides to the resource.
MORE PAPERLESS RESOURCES
♻ GOOGLE FORMS: Math Assessments
- 1st Grade Google FORMS Quizzes
- 2nd Grade Google FORMS Quizzes
- 3rd Grade Google FORMS Quizzes
- 4th Grade Google FORMS Quizzes
- 5th Grade Google FORMS Quizzes
♻ GOOGLE SLIDES: Interactive Math Centers
- 2nd Grade Google Slides Math Centers
- 3rd Grade Google Slides Math Centers
- 4th Grade Google Slides Math Centers
- 5th Grade Google Slides Math Centers
♻ GOOGLE FORMS: Math Spiral Review
- 2nd Grade Google FORMS Spiral Review
- 3rd Grade Google FORMS Spiral Review


