90 results
Women's History Month statistics centers for Microsoft PowerPoint
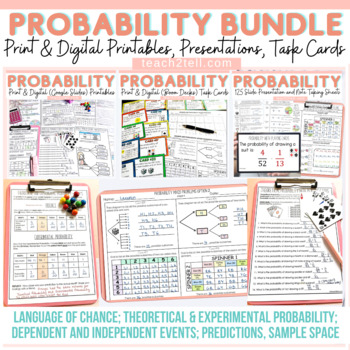
Chance and Probability Activities Theoretical & Experimental Probability Bundle
Are you teaching your students all about chance and probability and looking for fun hands-on probability activities? This print and digital bundle of worksheets, task cards, slideshows and note-taking sheets on Probability will reinforce the understanding of theoretical probability, experimental probability, language of chance, sample space, predictions, lists, tree diagrams, dependent probability events and independent probability events.Both US and British English spelling and terminology file
Subjects:
Grades:
4th - 7th
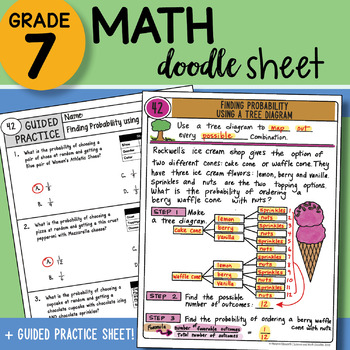
Math Doodle - Finding Probability using a Tree Diagram - Easy to Use Notes w PPT
7th Grade Math Doodle Sheet Product INCLUDES:Math Doodle Sheet - blank and keyGuided Practice Sheet - blank and keyPowerPoint – to show students the KEY– two versions of both sheets included: INB and large 8.5 x 11 size ALL TEKS Aligned– plan for the FULL year included with table of contents page for INB! SAVE BIG and buy the WHOLE YEAR SET found here:7th Grade Math Doodle Sheets ALL YEAR SET WHOLE YEAR SET List below:ALL TEKS Aligned– plan for the FULL year included! LIST of 88 Doodle Sheets p
Subjects:
Grades:
6th - 8th
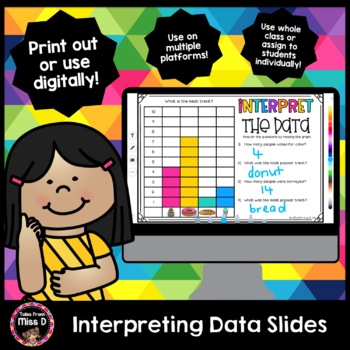
Interpreting Data Slides
Help develop students' ability to collate data and interpret graphs with these slides.There are two styles of questions;Tally - students count the data and use tally marksInterpret a Graph - students read the graph and answer questionsThese slides can be printed out, used in the classroom with your students or uploaded into your digital classroom for distance learning.Have a question? Use the Product Q & A or email me at talesfrommissd@gmail.comRelated ProductsSpin and GraphSight Word Spin a
Subjects:
Grades:
K - 2nd
Types:
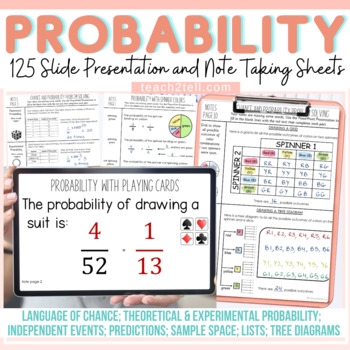
Chance and Probability Activities PowerPoint Presentations and Guided Notes
Are you teaching your students all about chance and probability and looking for fun hands-on probability activities? This Probability resource features 125 animated slides and 32 Cornell-style note-taking sheets to make abstract content on Chance and Probability more concrete.Your students will have a better understanding of theoretical probability, experimental probability, language of chance, sample space, predictions, lists, tree diagrams, and independent probability events.Both US and Britis
Subjects:
Grades:
4th - 8th
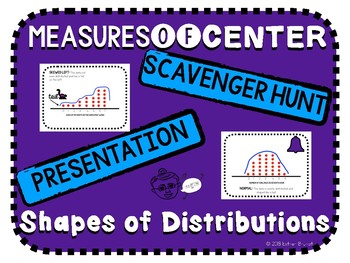
Shapes of Distributions and Measures of Center Scavenger Hunt and Presentation
A note to the teacherThis resource is for teaching shapes of distributions, analyzing the use of the mean versus the median, and deciphering which among the two is higher based on the shape of the distribution.This resource includes:Keynote and Powerpoint Presentation & PDF(Animated)Shapes of DistributionsNormalSkewed LeftSkewed Rigt2 Examples EachWhich Measure of Center is More Appropriate (Mean vs Median)6 Example Knowledge Check Which Measure of Center is Higher (Mean vs Median)?6 Example
Subjects:
Grades:
8th - 12th
Also included in: Math Activity Bundle
Probability project using Real-World March Madness Tournament
Jump into the March Madness tournament to apply probability concepts to a real-world application. Great for your sports-loving students. Students explore probability first by determining the probability that a team will win. Students, further, weight teams based on historical data and/or team statistics. This mini-project allows for creative problem-solving and has some open-ended answers.Included in this resource:★ Student pages for 3 March Madness related activities★ Detailed guidelines fo
Subjects:
Grades:
7th - 10th
Types:
Also included in: 7th Grade Math Resource Bundle
Statistics, Probability, and Data Slide Show for Grades 3 and 4
The vocabulary and concepts included are sets, data, survey, tally, charts, diagrams, graphs, key, mean, probability, combinations, and tree diagrams.The 49 PowerPoint slides are a combination of teaching (lecture style) and interactive slides (matching, fill-in, multiple choice, etc).Also included is a Directions Page for using PowerPoint and for using the PEN OPTION of PowerPoint.The Preview File is pages 1-11 of the Slide Show so that you can "Try before you Buy".~~~~~~~~~~~~~~~~~~~~~~~~~~~~~
Subjects:
Grades:
3rd - 4th
Also included in: Math for Grades 3-4 PowerPoint Slide Show BUNDLE Math Vocabulary
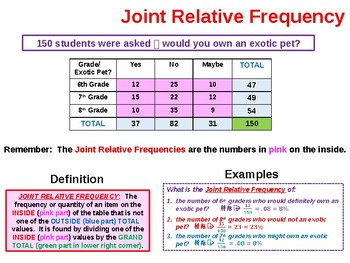
Two Way Frequency Tables Summary
This MS PowerPoint presentation provides background information on 2-Way Frequency Tables as well as the specific steps to follow create and analyze them. It is used to kickoff our study of this subject n my Pre-Algebra and Math I classes. It addresses all of the terms encountered in the construction and use of 2-Way tables including Joint Relative Frequency, Marginal Relative Frequency and Conditional Relative Frequency. It is a totally animated ppt file and very easy for students to underst
Subjects:
Grades:
8th - 10th
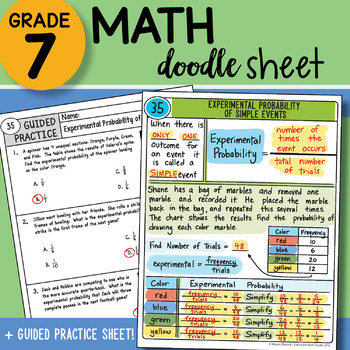
Math Doodle Sheet - Experimental Probability of Simple Events - Notes with PPT
7th Grade Math Doodle Sheet Product INCLUDES:Math Doodle Sheet - blank and keyGuided Practice Sheet - blank and keyPowerPoint – to show students the KEY– two versions of both sheets included: INB and large 8.5 x 11 size ALL TEKS Aligned– plan for the FULL year included with table of contents page for INB! SAVE BIG and buy the WHOLE YEAR SET found here:7th Grade Math Doodle Sheets ALL YEAR SET WHOLE YEAR SET List below:ALL TEKS Aligned– plan for the FULL year included! LIST of 88 Doodle Sheets p
Subjects:
Grades:
6th - 8th
Women’s History Month Reading Comprehension Passages - International Womens Day
Women’s History Month Biography Reading Comprehension PassagesStep on an educational journey as we dive into the biographies of trailblazing women who have shaped history. These carefully crafted reading comprehension passages offer insights into the lives and contributions of remarkable figures. The high-quality print-ready materials, versatile file formats, and comprehensive content ensure an enriching learning experience for students and educators alike. Explore the stories of these influenti
Grades:
3rd - 6th
Bundle Statistics and Probability | 50% Discount
PowerPoint presentations on statistics and probalility. Perfect for an online lesson or distance learning.You can send it to your students and they'll have everything they need. If you are online with them, you can project it and comment.Or you can simply print it and give to your students.Suitable for IB MYP Middle Years ProgrammeIt includes:Mean, Mode and Median.With examples and exercises, for students to practice.This product and:Distance Learning - Mean. Mode, Median - Google Slideshttps:/
Subjects:
Grades:
6th - 9th
Math 1 / Algebra 1 Bundle - Unit 9 Statistical Measures and Data Analysis
This bundle includes various instructional MS PowerPoint (PPT) slidepacks that I initially use when covering the Math 1/Algebra 1 content area titled: Unit 9 - Statistical Measures and Data Analysis. The following slidepacks are included in this bundle:Box and Whisker Plot Analysis and Construction including Outliers General Statistics - Mean, Median, Mode, Range and Mean Absolute Deviation Mean, Median, Mode, Range and Standard Deviation SummaryScatterplots and Correlation SummaryTwo Way Frequ
Subjects:
Grades:
9th - 12th
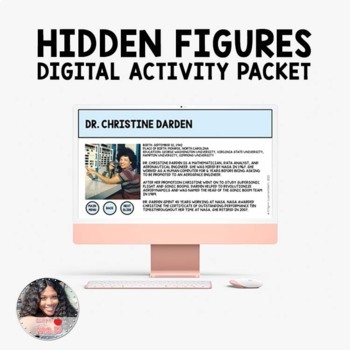
Women's History Month - Hidden Figures Interactive Google Slides
This is a Hidden Figures interactive Google Slides activity. This digital Women's History Month activity will keep students engaged as they learn about four influential people from NASA. Students will learn about Katherine Johnson, Mary Jackson, and Dorothy Vaughan. This reading comprehension resource will help your class learn about the accomplishments of four African American human computers women from NASA. Students can learn about these influential leaders in STEM and then write in this inte
Grades:
4th - 8th
Also included in: Black History Month Interactive Activity Bundle for Google Slides
Mean, Median, Mode, Range and Standard Deviation Summary
I use this MS PowerPoint presentation file to kickoff our study of Statistics in my 9th grade Math I or Algebra I classes. It reviews the definitions and detailed methods required to calculate the mean, median, mode, range and standard deviation of a data set(s). It is a totally animated ppt file and very easy for students to understand. Any of the ppt animations can be modified as desired by the presenter (teacher). It also includes 2 example problems for the students to complete at the en
Subjects:
Grades:
8th - 9th
CCSS:
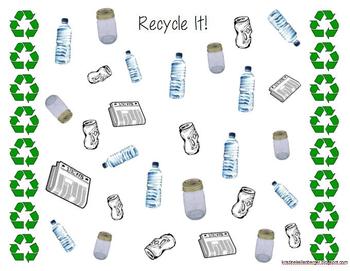
Recycle It! Tally Activity
This is my first worksheet to upload to TPT and I hope you can find it useful!This activity was created to incorporate Earth Day, recycling, and math concepts of tallying and graphing. Use the first page of the various items that we recycle (paper, glass, aluminum, and plastic) as a map to be left at a Math Center. The second page is the students' recording sheet. Students should mark a tally for each item, count the tallies, and then create a graph. There are two versions included, one full col
Subjects:
Grades:
K - 2nd
Mean - Median - Mode - Range -Understanding With Easy Steps!!!!
This power point presentation is prepared on statistical terms like mean, median, mode, and range. These terms describe properties of statistical distributions. In statistics, a distribution is the set of all possible values for terms that represent defined events.
The presentation is prepared in a very simple language with clear and simple example so that students of grades 3-4-5-6 can understand the concept smoothly. Easy steps for calculating the above terms will help students a lot in remov
Subjects:
Grades:
4th - 8th, Staff

Katherine Johnson and the Math (and Science) of Trajectories
This activity highlights the importance of the work of African American women like Catherine Johnson. It includes a read-aloud of the book Counting on Katherine and an activity demonstrating how trajectories can be altered using force and angle of motion. It would be a great addition to a unit on force and motion or a stand-alone activity.
Grades:
Not Grade Specific
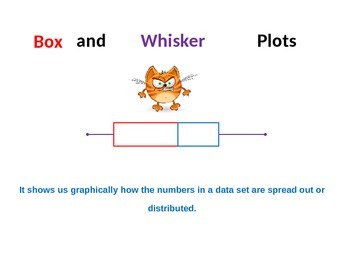
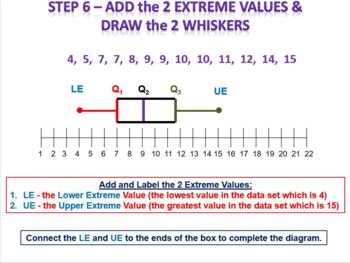
Box and Whisker Plot Analysis and Construction including Outliers
I use this MS PowerPoint presentation file to kickoff our study of Box Plots in my Pre-Algebra and Math I classes. It reviews in detail how to analyze a data set and to construct a Box Plot to accurately depict the distribution of the data (numbers). It is a totally animated ppt file and very easy for students to understand. Any of the ppt animations can be modified as desired by the presenter (teacher). It also includes 2 example problems for the students to complete at the end of the slid
Subjects:
Grades:
7th - 9th
CCSS:
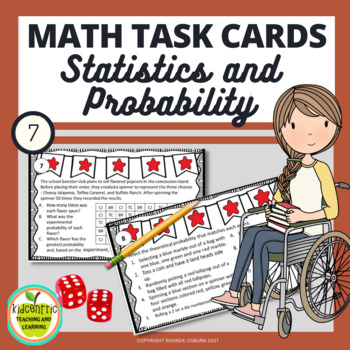
Math Task Cards - Statistics and Probability
Great versatile and engaging resource for reviewing the concepts of probability and statistics. Your seventh graders will be actively engaged as they use random sampling to draw inferences about a population, draw informal comparative inferences about two populations, and investigate, use, and evaluate probability models. There are many ways you can use these NO PREP cards with your 7th grade math class. Think how easily you can just print and use these cards with activities such as:Bellwork
Subjects:
Grades:
6th - 8th
Types:
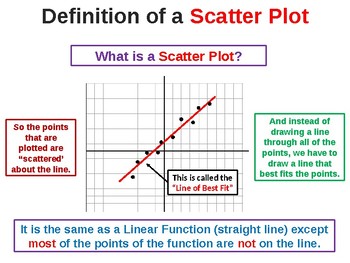
Scatterplots and Correlation Summary
This MS PowerPoint presentation covers the specifics of both Scatterplots and Correlation. It is used to kickoff our study of these topics in my Pre-Algebra and Math I classes. It covers the detailed steps to follow to analyze a data set and construct a Scatterplot and Line of Best Fit as well as determine the Correlation of the data. It covers the steps to use with to determine these measures without a graphing calculator. It is a totally animated ppt file and very easy for students to unde
Subjects:
Grades:
8th - 10th
CCSS:
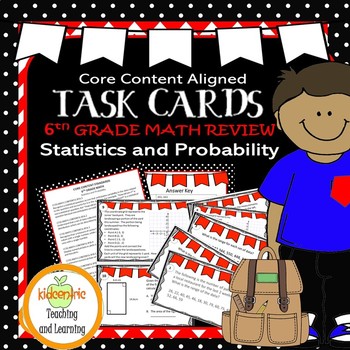
Math Task Cards 6th Grade Statistics Probability | Mean, Median, Number Lines
This set of Sixth Grade Math Task Cards review majors concepts of mean, median and the distribution of numerical data sets on a number line, including dot plots, histograms, and box plots. Checking your student's understanding of the Core Content Domain of Ratios and Proportional Relationships, the cards may be used by individual students, or as the basis for cooperative group work. Versatile and engaging, there are many ways you can use these NO PREP cards with your class. Think how easily y
Subjects:
Grades:
5th - 7th
Types:
Describe the Distribution of a Data Set
This Common Core statistics and probability lesson teaches students how to describe the distribution of a data set. The lesson includes research-based strategies and strategic questions that prepare students for Common Core assessments. In this lesson, students will describe the distribution of data sets. This lesson focuses on describing a variety of statistical distributions in different situations. Students are asked to describe different related data sets and describe what that means. In
Subjects:
Grades:
5th - 7th
About Harriet Tubman - Adapted Book (Editable) / Women's History Month
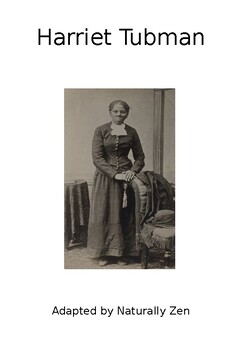
Looking for an interactive activity to teach your students about historical figures and heroes during Black History Month. This fun adapted book shares facts about important people throughout history while using real life pictures. Adapted books are perfect for your emergent readers, English Language Learners and are especially useful for student with autism and other special education needs. Interactive adapted books are a great addition to your guided, shared, or independent reading activities
Grades:
PreK - 11th
Also included in: Black History Month Bundle - Adapted Books (PPT)
Comparing Circle Graphs to Other Graphs Practice
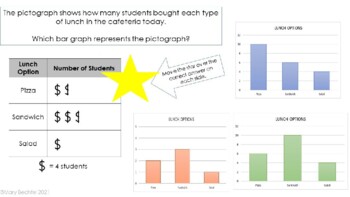
In this PowerPoint activity, students will be given a pictograph, bar graph, line/dot plot, or circle graph and will be asked which graph represents the same data. 5 practice slides are provided, as well as a final slide which asks students which type of graph is best for answering certain questions.This is also available as a Google Slides activity!
Subjects:
Grades:
6th - 8th
Types:
Showing 1-24 of 90 results


