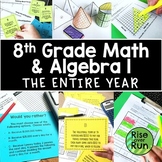
TPT
Total:
$0.00

Rise over Run

 (24,067)
United States - Tennessee - Columbia
Rise over Run
4.9
40,335 votes
 
FREE Download
Assess the general quality of my work with this free download
clear search
Leader Board Superb
My Products
sort by:
Best Sellers
view:
★ Statistics, Probability, Scatter Plots
By Rise over Run
Practice using scatterplots with these six activities. They can be used as bell ringers, exit tickets, homework, or just general practice. Students graph points, interpret data, and look for types of correlation with these practice sheets. All
Subjects:
Math, Algebra, Graphing
Grades:
8th, 9th
Types:
Worksheets, Homework, Google Apps
CCSS:
8.SP.A.1, 8.SP.A.2, HSS-ID.B.6
$6.00
150
Digital Download PDF (0.70 MB)
By Rise over Run
Grab these guided notes and "cheat sheets" to help your students understand statistics standards from Algebra I. Included Topics: Statistics Basics (mean, median, mode, range, dot plots, histograms, stem and leaf plots) Box and Whiskers Mean
Subjects:
Math, Algebra, Statistics
Grades:
9th, 10th
Types:
Handouts, Scaffolded Notes
CCSS:
HSS-ID.A.1, HSS-ID.A.2, HSS-ID.A.3
$5.75
59
Digital Download PDF (0.64 MB)
By Rise over Run
Look for fun probability activities? Students get creative as they design games for gameshows in this engaging project about simple and compound probability! Instructions are included to guide students in completing the following:Design a game based
Subjects:
Math, Statistics
Grades:
7th, 8th, 10th
Types:
Projects, Activities
CCSS:
7.SP.C.5, 7.SP.C.6, 7.SP.C.7, 7.SP.C.7a, 7.SP.C.7b, 7.SP.C.8, 7.SP.C.8a, 7.SP.C.8b, 7.SP.C.8c
$3.00
16
Digital Download PDF (0.45 MB)
By Rise over Run
Practice creating and analyzing scatter plots with these six differentiated real world projects. Students are provided statistics for a sport and must graph the data. Then, they write an analysis describing correlation, whether or not the data is
Subjects:
Math, Graphing, Statistics
Grades:
8th, 9th
Types:
Projects, Activities
CCSS:
8.SP.A.1, 8.SP.A.2, HSS-ID.A.3, HSS-ID.B.6, HSS-ID.B.6a
$4.00
61
Digital Download PDF (0.81 MB)
By Rise over Run
Use statistics for a real world application with this engaging activity about space stats! Students use real data to create histograms, box and whiskers plots, as well as calculate median, mean, range, interquartile range, and mean absolute
Subjects:
Math, Math Test Prep, Statistics
Grades:
6th, 7th, 9th
Types:
Activities, Google Apps, Microsoft OneDrive
CCSS:
6.SP.A.1, 6.SP.A.2, 6.SP.A.3, 6.SP.B.4, 6.SP.B.5c
$5.00
55
Digital Download ZIP (5.43 MB)
By Rise over Run
Need an engaging lesson to help students understand correlation coefficients? In this PowerPoint and card sort activity, students interpret scatter plots and association patterns to determine correlation coefficients.Here's what is included:Intro
Subjects:
Math, Algebra, Graphing
Grades:
9th
Types:
PowerPoint Presentations, Activities, Task Cards
CCSS:
HSS-ID.C.8
$3.00
46
Digital Download ZIP (0.65 MB)
By Rise over Run
Need an engaging way to get students learning about two way tables and bivariate data? This set of fill-in cheat sheets and practice helps students make sense of data and statistics represent in 2 way frequency tables. This set includes:Two Way
Subjects:
Math, Algebra, Statistics
Grades:
8th, 9th
Types:
Worksheets, Scaffolded Notes, Interactive Notebooks
CCSS:
8.SP.A.4, HSS-ID.B.5
$3.75
25
Digital Download PDF (0.54 MB)
By Rise over Run
Help students understand statistics vocabulary, dot plots, histograms, and box and whiskers diagrams, and mean absolute deviation with this resource.The three-page handout comes in two formats:Reference “Cheat Sheet” with all information filled in
Subjects:
Math, Math Test Prep, Statistics
Grades:
6th, 7th, 9th
Types:
Handouts, Scaffolded Notes
CCSS:
6.SP.B.4, 6.SP.B.5c, 7.SP.B.3, 7.SP.B.4, HSS-ID.A.1
$3.00
56
Digital Download PDF (0.42 MB)
By Rise over Run
Detailed sheets for the following topics: •Types of Association & VocabularyThis page shows examples of positive, negative, strong, weak, linear, and nonlinear association. It also shows clusters and outliers.•Line of Best FitThis page explains
Subjects:
Algebra, Graphing, Statistics
Grades:
8th, 9th
Types:
Study Guides, Handouts, Interactive Notebooks
CCSS:
8.SP.A.1, 8.SP.A.2, 8.SP.A.3, HSS-ID.B.6, HSS-ID.B.6a, HSS-ID.B.6b, HSS-ID.B.6c, HSS-ID.C.7, HSS-ID.C.8
$3.50
28
Digital Download PDF (0.44 MB)
By Rise over Run
Help students understand how and why to use box & whiskers plots with this real world application using data about temperatures in different cities. Students use data about the highest average temperature for each month in a city. They locate
Subjects:
Math, Statistics
Grades:
6th, 7th
Types:
Projects, Activities
CCSS:
6.SP.B.4, 6.SP.B.5c, 7.SP.B.4
$3.75
18
Digital Download PDF (0.84 MB)
By Rise over Run
Practice creating dot plots and box & whiskers plots with this statistics activity.Students are given scores for 2 basketball teams. They use the data to create a dot plot (or line plot) for each team and then a box and whiskers diagram for
Subjects:
Math, Algebra, Statistics
Grades:
6th, 7th
Types:
Worksheets, Handouts, Homework
CCSS:
6.SP.B.4, 7.SP.B.3, 7.SP.B.4, HSS-ID.A.1, HSS-ID.A.2, HSS-ID.A.3
$1.00
80
Digital Download PDF (0.34 MB)
By Rise over Run
Engage students in learning about scatter plots with this bundle of activities! The activities and lessons include real world examples to help students see the relevance and importance of scatter plots!Included:Scatter Plot Experiment
Subjects:
Math, Algebra, Graphing
Grades:
8th, 9th
Types:
Worksheets, Unit Plans, Activities
CCSS:
8.SP.A.1, 8.SP.A.2, 8.SP.A.3, HSS-ID.B.6, HSS-ID.B.6a, HSS-ID.B.6b, HSS-ID.B.6c, HSS-ID.C.7, HSS-ID.C.8
$20.99
$14.00
28
Bundle
By Rise over Run
In this inquiry lesson, students get to measure circles and discover the relationship between circumference and diameter! They measure circles in the classroom (or that they bring from home), graph a scatterplot, make connections, and discover the
Subjects:
Math, Geometry, Graphing
Grades:
7th, 8th, 9th
Types:
Activities, Handouts, Scaffolded Notes
CCSS:
7.G.B.4, 8.SP.A.1
$2.00
29
Digital Download ZIP (5.36 MB)
By Rise over Run
Practice finding theoretical probability associated with rolling a number cube using this fun collaborative coloring challenge! Here's how it works:Students work in groups of 4. Each group member gets a different sheet of problems to solve. They
Subjects:
Math, Math Test Prep, Word Problems
Grades:
7th, 8th, 9th, 10th
Types:
Activities
CCSS:
7.SP.C.5, 7.SP.C.6, 7.SP.C.7, 7.SP.C.7a, 7.SP.C.8, 7.SP.C.8a, 7.SP.C.8b
$3.50
31
Digital Download PDF (4.72 MB)
By Rise over Run
Need an engaging way to get students thinking about simple probability events? Grab this card sort and follow-up worksheet with questions! Here's what's included:Card Sort with 15 eventsFollow-up worksheetAnswer KeyThe card sort gives students 15
Subjects:
Math, Statistics, Word Problems
Grades:
7th, 8th
Types:
Worksheets, Activities, Task Cards
CCSS:
7.SP.C.5, 7.SP.C.7, 7.SP.C.7a
$3.00
20
Digital Download PDF (0.58 MB)
By Rise over Run
No more boring box plot lessons! These activities are engaging and will help your students see how box plots are really useful with real world data. Grab these 5 resources, print, and be ready to go! Here are the resources included in this
Subjects:
Math, Math Test Prep, Statistics
Grades:
6th, 7th
Types:
Unit Plans, Activities, Lesson
CCSS:
6.SP.A.1, 6.SP.A.2, 6.SP.A.3, 6.SP.B.4, 6.SP.B.5, 6.SP.B.5c, 6.SP.B.5d, 7.SP.B.3, 7.SP.B.4
$15.50
$9.00
6
Bundle
By Rise over Run
Practice comparing data shown in dot plots and box and whiskers diagrams with these 5 display sheets. Here's what's included:5 Data Display Sheets (Each sheet gives 2 sets of comparable data. The data is shown in dots plots and in box and whiskers
Subjects:
Math, Math Test Prep, Statistics
Grades:
6th, 7th
Types:
Handouts, Scaffolded Notes
CCSS:
6.SP.B.4, 7.SP.B.3, 7.SP.B.4
$3.00
29
Digital Download PDF (0.49 MB)
By Rise over Run
Students create a scatterplot based on data from an experiment and answer questions related to their graph. This activity can be completed as a whole class with guidance to introduce scatter plots and the vocabulary. Or, it may be used as
Subjects:
Math, Graphing, Statistics
Grades:
8th, 9th
Types:
Worksheets, Activities, Interactive Notebooks
CCSS:
8.SP.A.1, 8.SP.A.2, 8.SP.A.3
$1.99
38
Digital Download PDF (0.57 MB)
By Rise over Run
Explore non-linear scatter plots with these activity sheets! Included are 6 different sheets that each include a description of data collection, a table of data, a graph, and questions to encourage thinking. Students use the given data to create a
Subjects:
Algebra, Graphing, Algebra 2
Grades:
9th, 10th, 11th, 12th
Types:
Worksheets, Activities
CCSS:
HSS-ID.B.6, HSS-ID.B.6a, HSS-ID.B.6c
$4.00
10
Digital Download PDF (0.69 MB)
By Rise over Run
Need a real world scatter plot activity where students use their graphing calculators? Grab this activity and help your students understand lines of best fit and calculating correlation coefficients!Students are given data on house sizes, house
Subjects:
Algebra, Graphing, Statistics
Grades:
8th, 9th
Types:
Worksheets, Activities, Assessment
CCSS:
HSS-ID.B.6, HSS-ID.B.6a, HSS-ID.B.6b, HSS-ID.B.6c, HSS-ID.C.7, HSS-ID.C.8
$2.00
26
Digital Download PDF (0.33 MB)
showing 1-20 of 25
Ask Rise over Run a question. They will receive an automated email and will return to answer you as soon as possible. Please Login to ask your question.