56 results
Graphing graphic organizers for Microsoft PowerPoint
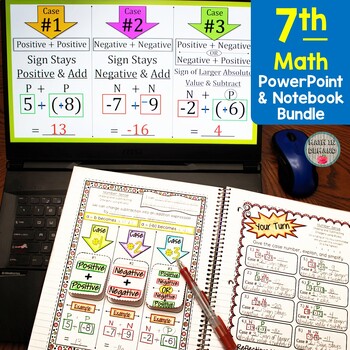
7th Grade Math Notebook & PowerPoint Bundle
This bundle includes my popular 7th Grade Math Interactive Notebook and 7th Grade Math PowerPoints. It includes math concepts for the ENTIRE SCHOOL YEAR! There are 65 PowerPoints that are perfectly aligned to my notebook. All you need to do is open the PowerPoint and click F5. Each PowerPoint includes animations and is editable!The Notebook & PowerPoints include the following math concepts:Unit 1 - Number Sense✅ Absolute Value✅ Rational Numbers on the Number Line✅ Adding and Subtracting Inte
Grades:
7th
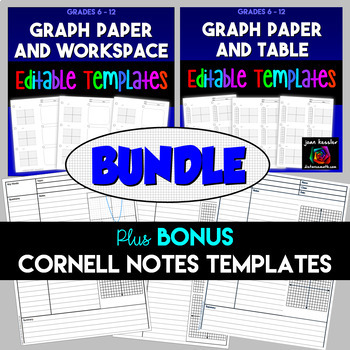
Graph Paper Editable Templates Bundle plus Cornell Notes
I have bundled together two of my very popular time-saving Editable Graphing Templates and added as a bonus two Cornell Notes Templates with Graphs. Use the templates as is, just Print & Go, or add text boxes, graphs, or equations with your favorite editor. The two bundled templates are in both PowerPoint and PDF and the bonus templates are in PowerPoint.___________________________________________________________ You may also like: ★ Foldable Flip Book Editable Double-Sided Template Bundl
Subjects:
Grades:
7th - 10th
Geographical Features of Earth - PowerPoint and Activities
Great science unit on describing geological features of Earth, including bodies of water, beaches, river, lakes, ocean ridges, continental shelves, plateaus, faults, canyons, sand dunes, island, peninsula, mountains, hills, plains, plateaus, and ice caps.
All taught with a PowerPoint and printable that go along with it to make sure the students understand objectives above. If you have this objective in your state. You can cover it with this PowerPoint and activity sheets very easy! I love easy
Subjects:
Grades:
3rd - 9th

Transformations of y=x2 in Vertex Form - Organizer and Presentation
This one page graphic organizer (pdf) summarizes the transformations on the quadratic y=x2 in vertex form by looking individually at influence the values of a, h, and k have on the final parabola, using the acronym haak. The organizer can be used on its own or paired with the matching presentation (pdf).Originally created for my grade 10s (Ontario's MPM2D), this resource is also suitable for Ontario's MFM2P, MBF3C, MCF3M, and MCR3U courses, or any course where the vertex form of the quadratic r
Grades:
9th - 11th
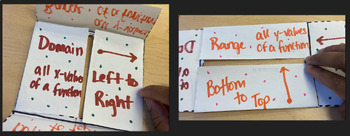
Domain and Range Foldable
This activity can be used as an interactive notebook insert. Students can use the foldable on top a graph of a function, and create a visual representation of both the domain and range. This activity promotes critical thinking, differentiated instruction, and use of visual aid
Subjects:
Grades:
10th - 12th
CCSS:
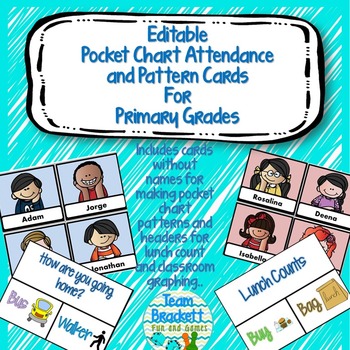
Pocket Chart Attendance and Pattern Cards for Primary Grades - editable
Give your students a sense of responsibility by having them record their attendance and other classroom data. The customizable cards can be used in a pocket chart for gathering data on attendance, lunch count, transportation and a number or other class routines. Blank header cards allow you to create your own data sets.
The cards include multicultural kids with visual clues for even the youngest students. Not only will your students love being able to move their own card to itps appropriate hea
Subjects:
Grades:
PreK - 5th
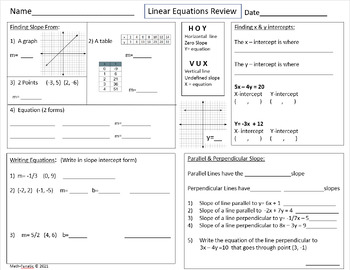
Linear Equations Review Graphic Organizer (all on 1 sheet!)
This Linear Equations Review Graphic Organizer is great 1 page review that you can use as a guided review lesson or review cheat sheet! Students can reference it when working on review activities or when reviewing for an EOG or EOC. I copy it on colored paper and use it as a guided review lesson mostly, I have also had students fill it out first, then I go over it to ensure understanding. This GO includes review of (with practice):*Finding Slope (from a graph, 2 points, table, & equation
Grades:
8th - 12th

Coordinate Plane Lesson PowerPoint
This PowerPoint goes with the coordinate plane cloze notes for students. Students will in the notes as the teacher presents the powerpoint. This can be used to teach 6th grade common core, 6.NS.6, graphing on a coordinate plane. It can also be used to review graphing on the coordinate plane prior to teaching 7.RP.2, 8.G.2, 8.G.3, 8.G.4, 8.G.8, 8.F.4, 8.F.1, 8.EE.5, 8.EE.6, 8.EE.7, or 8.EE.8.
Grades:
6th - 8th
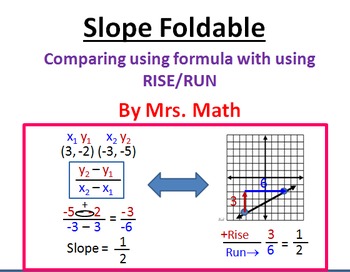
Slope Formula and Rise/Run Foldable
Power Point includes animated step-by-step instructions for creating a foldable for comparing graphing using slope formula and using RISE/RUN to determine the slope from a graphs. Materials needed for each student: scissors, ruler, 2 to 3 markers, 2 printable graphs (provide in power point), glue, and a piece of card-stock or construction paper.
Mathematical foldables (or graphic organizers) are a great way to put important information at students fingertips. They can be used to introduce con
Grades:
7th - 10th
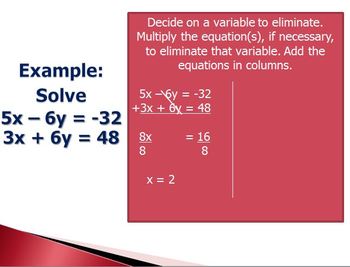
Solving Systems of Equations
Includes 4 PowerPoints with matching foldable (graphic organizer) for solving systems of equations: Solving by Graphing, Solving Using Substitution, Solving with Substitution Day 2 with Special Cases, and Solving Using Elimination. Students can use the foldable to take notes and show the same problem worked with each method. The foldable can be added to an interactive book or journal.
Grades:
8th - 11th
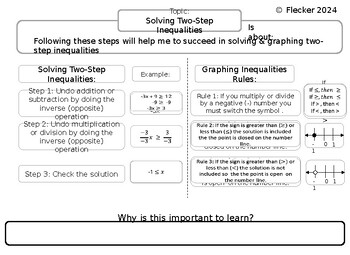
Solving Two-Step Inequalities
Are your struggling with learning how to solve two-step inequalities? Then look no further this graphic organizer will help to explain how to solve two step inequalities and how to graph them on a number line. Slide 1: Copy of the finished handoutSlide 2: Blank copy of graphic organizerSlide 3: Cloze notes (Fill in the blanks) graphic organizerSlide 4: Answer key to Cloze Notes graphic organizer
Subjects:
Grades:
7th - 9th
CCSS:
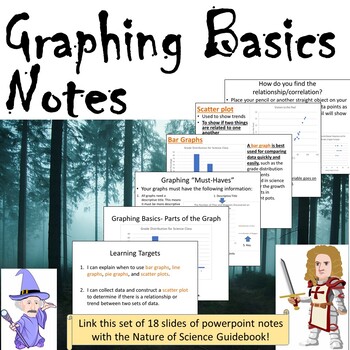
Powerpoint Notes- Graphing Basics: The 4 Most Common Graph Types
Presented here is a powerpoint (pptx file) set of notes consisting of 18 slides concerning graphing basics for bar graphs, line graphs, pie graphs, and scatter plots. These notes include images and definitions for terms concerning graphing types and purposes and is linked to the Nature of Science Guidebook where students can record their findings. There is also a short activity where students examine data sets and determine which type of graph would best match!These notes can serve as a perfect
Subjects:
Grades:
6th - 9th
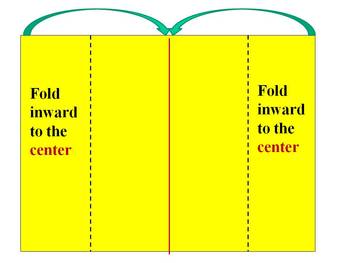
Graphing using standard form and x & y-intercepts Foldable
Power Point includes animated step-by-step instructions for creating a foldable for comparing graphing using "slope-intercept form to graphing using x and y-intercepts. The two graphing concepts that are easily confused by students so this foldable is very helpful. Materials needed for each student: scissors, ruler, 2 to 3 markers, 2 printable graphs (provide in power point), glue, and a piece of card-stock or construction paper.
Mathematical foldables (or graphic organizers) are a great wa
Grades:
7th - 10th

Genetic Diseases: Would you want to know? SLIDESHOW/SURVEYS/GRAPH
This bundle allows students to think about family members that might be ill or have a disease allowing students to get personal about the topic of a genetic disease.Students build on their personal experience by viewing a slideshow about 12 common inherited diseases and take notes on these diseases.Students will then critically think and voice their opinions when the class is surveyed and data is collected about "Would you want to know if you were going to inherit a disease?" Discussions are en
Subjects:
Grades:
5th - 8th
NGSS:
MS-LS3-1
, MS-LS3-2
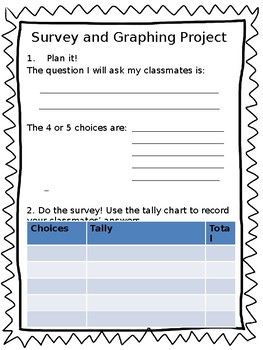
Data Management Survey Project
This can be used as a cumulative task at the end of the Data Management/Graphing Unit. Includes tally chart, pictograph template, graph paper for a bar graph, and space to interpret findings.
Subjects:
Grades:
2nd - 3rd
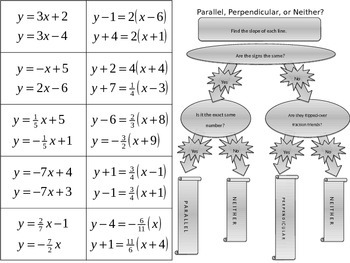
Parallel, Perpendicular, or Neither?
Notebook items for deciding if lines are parallel, perpendicular, or neither. These activities work well for lower-level, at risk, and exceptional learners.
Grades:
7th - 10th
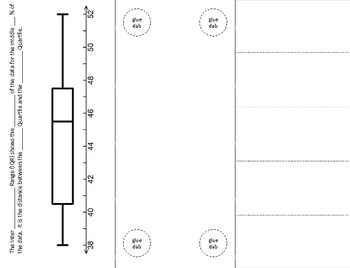
Creating a Box Plot Foldable
TEKS
represent numeric data graphically, including dot plots, stem-and-leaf plots, histograms, and box plots.[6.12A]
interpret numeric data summarized in dot plots, stem-and-leaf plots, histograms, and box plots.[6.13A]
Subjects:
Grades:
6th - 8th

Creative Curriculum Box Study Investigations
This is a 40 page powerpoint that goes through day by day of the box study aligned with the Creative Curriculum. It features each Question of the Day and other important graphing, planning, and webbing featured in the study. It is a great way to keep all your documentation in one spot and always ready to go!
Subjects:
Grades:
PreK
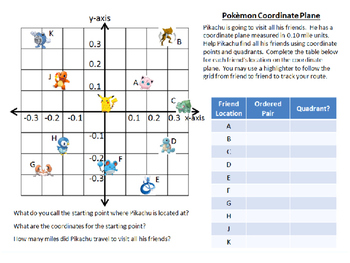
Pokemon Go Coordinate Graphing Activity
Pikachu is going to visit all his friends. He has a coordinate plane measured in 0.10 mile units. Help Pikachu find all his friends using coordinate points and quadrants. Complete the table below for each friend’s location on the coordinate plane. You may use a highlighter to follow the grid from friend to friend to track your route.
Subjects:
Grades:
5th - 7th
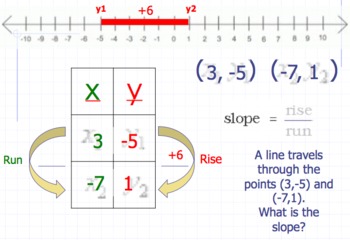
Teaching Slope of a Line using Graphic Organizers
Included:
Before Class Works and Exit Tickets in Open Response Format
Graphic Organizers to calculate slope on a graph, table, and from an equation
Perfect for ELLs and Resource
Subjects:
Grades:
5th - 10th

Drawings on a Coordinate Plane Lesson PowerPoint
This PowerPoint teaches how to draw polygons on a coordinate plane, which is from 6th grade common core math 6.G.3. There is a follow up activity to practice drawings on the coordinate plane.
Grades:
6th
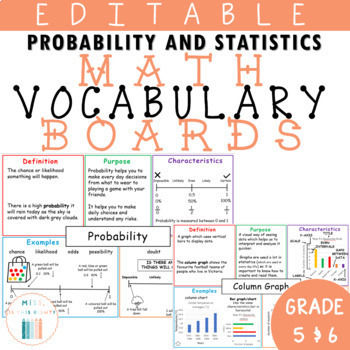
Probability activity - Frayer Model
This probability activity is a new effective method to help your students learn statistics and probability in a visual way. The Math Vocabulary Boards will have your students exploring statistic and probability definitions, purpose, characteristics, examples and non-examples. This activity for probability is designed to help EAL/ESL and SEN students. They are perfect for a classroom display or to be used in whole class lessons, small groups and individual activities. ⭐Be sure to check out my Mat
Subjects:
Grades:
5th - 6th
Also included in: Math Vocabulary Activity - Frayer Model
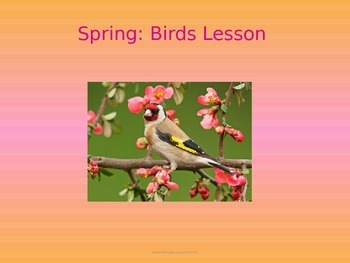
Bird Lesson-SPRING
Look into the different types of birds. Have your students observe them and learn about them with a visual slideshow. The slideshow gives facts about the birds and at the end there is a quiz. Post lesson, take students for a walk or look out the window to note the birds they see. You could even create a bird feeder! Students can create a graph to see which birds they saw the most or the least.
Subjects:
Grades:
1st - 12th
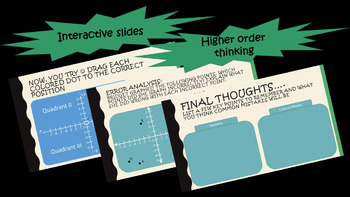
Digital Interactive Notebook: Graphing points in the Coordinate Plane
Students will be introduced to graphing points in the coordinate plane (all 4 quadrants). This is also a great "refresher" before teaching other concepts related to the coordinate plane.
This presentation can be used as a whole group activity (using PowerPoint on your projector) or as an individual assignment (either through PowerPoint or Google Slides). This will make a great addition to your digital interactive notebook. You can also print the slides and use them as guided notes.
Here is a b
Grades:
5th - 9th
Showing 1-24 of 56 results


