21 results
Common Core 7.SP.A.2 research by TpT sellers for TpT sellers
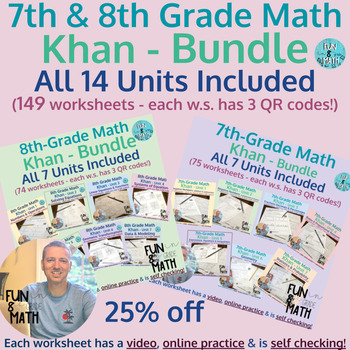
7th & 8th Grade Khan Bundles (149 total lessons)
This product contains 149 worksheets for the 7th and 8th grades, at a discounted price of 25% off the listed prices! Each grade has all 7 units included. Each worksheet contains practice problems and three QR codes. All of the QR codes in this document can either be scanned with a device or clicked on. I also included an answer key for each worksheet. The student starts by scanning the top QR code which takes them to a Khan Academy video. The student watches the video and takes notes in the fir
Subjects:
Grades:
6th - 9th
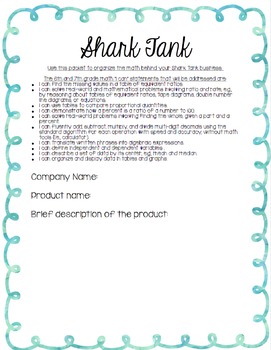
Shark Tank Project
Based on the hit show Shark Tank, students will create a product and business plan to pitch to the "Sharks". This product comes complete with the student packet, certificate for students, questions/script for the sharks, and teacher hints for how to make this a hit!All tasks within the project are connected to 6th and 7th grade CCSS math standards. "I Can" statements are provided in the student packet.Students will:-Create a company name and product-Determine the cost per product to make-Determi
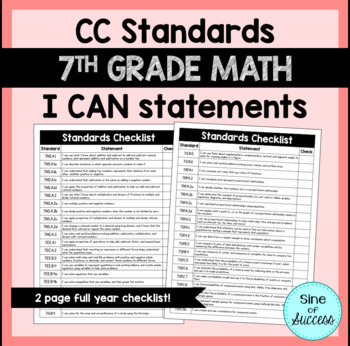
I CAN STATEMENTS 7th Grade Math Common Core Standards
Full checklist for 7th grade common core math standards.This two page checklist includes every CC standard rewritten as a simplified, student friendly I CAN statement. Students can hold onto this all year (in a binder or math folder) and self-evaluate throughout the year.Simple double sided printing and done!- - - - - - - - - - - - - - - - - - - - - - - - - - - - - - - - - - - - - - - - - - - - - - - - - - - - - - - - - - - - - - - - - - - - Check out my other products at my TpT store, Sine of
Subjects:
Grades:
7th
Find the Error - Data and Graphs with Central Tendency and Variation
This is an activity that I created for my students to find the mistake when a student has answered questions from graphs about measures of center and variation incorrectly. I used common errors to help them see the mistakes commonly made. All of my products are common core aligned.I had the students work alone to solve the problems first, and then share with their groups. If there was any discrepancy, they looked in the answer folder on their tables to see the correct answer. I rotated around
Subjects:
Grades:
5th - 7th
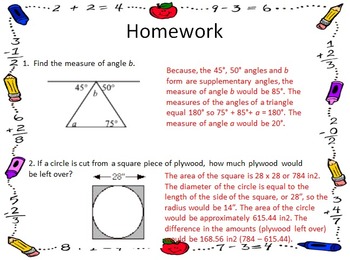
7th Grade Math Test Prep - Can be used as Station Review
This is a power point presentation that has 71 different homework assignments that could be used as warm ups if you choose. This is NOT the same power point as my "warm ups for the year" power point. This power point includes:12 Rational Numbers Homework Assignments13 Expressions and Equations Homework Assignments12 Ratios, Rates, Proportions, & Percent Homework Assignments8 Data Homework Assignments17 Geometry Homework Assignments9 Probability Homework Assignments
Subjects:
Grades:
7th
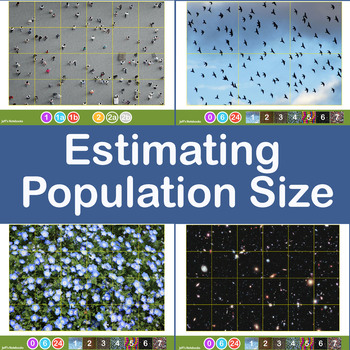
Estimating Crowd and Population Size using Jacob's Method
This investigation delves into estimating the size of a large population of objects by taking a sample and applying some basic mathematics. It encourages sharing of data, refining methods of collection of the data and discussion about the accuracy and limitations of the method used.Jacob's Method of counting large numbers of objects is simple. Draw a grid dividing the area covered into equal size squares. Estimate (by counting) the population of one grid then multiply this by the number of squar
Subjects:
Grades:
6th - 11th, Higher Education, Adult Education
Pandemic Cross-Curricular Project (Coronavirus Distance Learning)
Items included in this resource (PDF and Editable):-Project Title Page-Table of Contents-PBL Letter from the CDC-Generic Overview of Project-Math Assignment (Crossed with Science)-Science Assignment (Crossed with Math, Social Studies, and ELA)-Social Studies Assignment (Cross with Math, Science, and ELA)-ELA (Crossed with Science and Social Studies)-Due Date Table (Rough and Final Drafts)-Help Session Table (Math, Science, Social Studies, ELA)-Rubrics (Math, Science, Social Studies, ELA)-Resourc
Subjects:
Grades:
5th - 9th
CCSS:
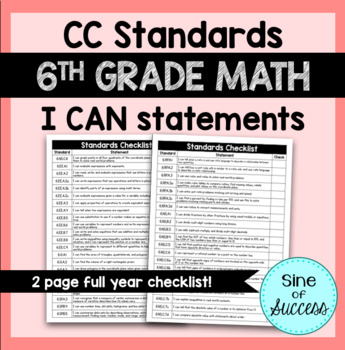
I CAN STATEMENTS 6th Grade Math Common Core Standards
Full checklist for 6th grade common core math standards.This two page checklist includes every CC standard rewritten as a simplified, student friendly I CAN statement. Students can hold onto this all year (in a binder or math folder) and self-evaluate throughout the year. Simple double sided printing and done!I use this regularly with my students. Throughout a unit, I post the standard we are working on somewhere in the classroom for students to see. Students use this checklist to reference the
Subjects:
Grades:
6th
6 Editable Bar Graph Templates 2.0
Finally a simple and professional graph space that students can fill out without any design issues getting in the way. This file contains 6 ready-to-use graph options. Print them and have students fill them with pencil and ruler, or distribute them over computer and let them practice entering the data. Get a project perfect finish every time. Maybe you just want to fill it out live on a projector? The possibilities are endless! It's okay to say you love these bar graphs. So do we.Contains:- 2 bl
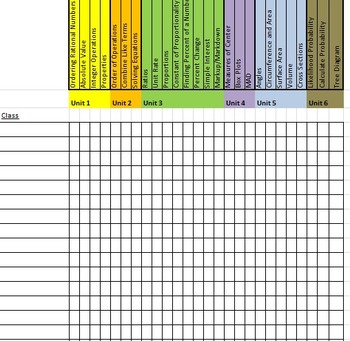
Checklist of Concepts in Each Unit - 7th Grade Math Common Core
This is an excel spreadsheet that has concepts that need to be tested and differentiated throughout the year for 7th grade math. You simply need to add your student names and begin documenting. This document will be very helpful for TKES, the new teacher evaluation system for the state of Georgia.
Subjects:
Grades:
7th
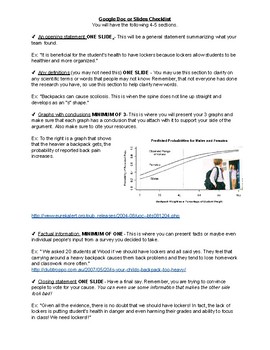
Statistics Debate Project
This is a final projects for students to do to end the statistic unit. It allows them to explore real life graphs and use them to build on their side of the argument. Students learn public speaking skills, powerpoint making skills, research skills, and how to read real like graphs.
Subjects:
Grades:
6th - 8th
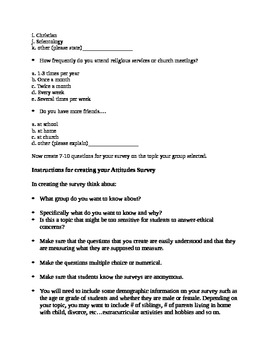
Research Paper-integrating Math and Science
This is a research paper that breaks down the topic and methodology into sections. The project is student driven. Student groups decide on a reseach topic that they can actually research but also create a survey to administer to students in the school so that they are collecting their own data.
The booklet begins with students creating survey questions, but you may want to first have them do the intro to the paper and their hypotheses before creating the survey questions.
Science is integrate
Subjects:
Grades:
7th - 12th, Adult Education
Types:
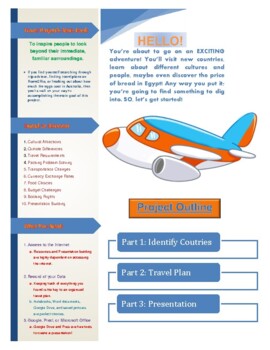
World Travel Presentation: Geography, Economics, ELA Distance Learning Project
***PLEASE REVIEW THIS PRODUCT*** Are you ready for your biggest adventure yet?This product includes:Instructor and student guided lesson planTravel project outlineSpecific resourcesWebsite directional instructions Custom graphic organizer printable templatesPrezi account instructionsIntegrated subject learning: Geography, Economics, Mathematics, English, History, Technology, HealthDeep learning, real world considerationsBudgeting practice Creative writing story promptUse this product again and a
Subjects:
Grades:
4th - 12th
Types:
Statistics and Probability - Word Wall
6th, 7th, and 8th Grade Vocabulary Word Wall Words
Subjects:
Grades:
6th - 8th

Middle School Math Sampling Common Core Project
A sampling project for your middle school students. Have the students investigate various forms of sampling (systematic, voluntary-response, convenience and random). Allows for student creativity and for analysis about survey bias. Rubric including for scoring.
Subjects:
Grades:
5th - 8th
Passion-Driven Statistics E-book (Introductory/AP Statistics Course Textbook)
Passion-Driven Statistics is an NSF-funded, multidisciplinary, project-based curriculum that supports students in conducting data-driven research, asking original questions, and communicating methods and results using the language of statistics. The curriculum supports students to work with existing data covering psychology, health, earth science, government, business, education, biology, ecology and more. From existing data, students are able to pose questions of personal interest and then use
Subjects:
Grades:
6th - 12th, Higher Education, Adult Education
Types:
SPSS software Secondary Data Analysis Workshop (Introductory/AP Statistics)
This handout is intended for those interested in teaching/learning basic introductory statistics concepts to analyze real data. Students will learn how to tell a story using secondary data analysis. The handout is for SPSS and the US Longitudinal Study of Adolescent Health data set. For handouts on the data set code book and raw data file, a PowerPoint to accompany the handout, or questions please email kristin.flaming@gmail.com or ldierker@wesleyan.edu.This handout was developed as a condensed
Subjects:
Grades:
6th - 12th, Higher Education, Adult Education
Types:
STATA software Secondary Data Analysis
This handout is intended for those interested in teaching/learning basic introductory statistics concepts to analyze real data. Students will learn how to tell a story using secondary data analysis. The handout is for STATA software and the US Longitudinal Study of Adolescent Health data set. For handouts on setting up an account, the data set code book and raw data file, a PowerPoint to accompany the handout, or questions please email kristin.flaming@gmail.com or ldierker@wesleyan.edu.This
Grades:
6th - 12th, Higher Education, Adult Education
Types:
SAS software Secondary Data Analysis Workshop (Introductory/AP Statistics)
This handout is intended for those interested in teaching/learning basic introductory statistics concepts to analyze real data. Students will learn how to tell a story using secondary data analysis. The handout is for SAS (email for R, SPSS, Stata, & Python), a free cloud based system and the US Longitudinal Study of Adolescent Health data set. For handouts on setting up a free SAS account, the data set code book and raw data file, a PowerPoint to accompany the handout, or questions please e
Grades:
6th - 12th, Higher Education, Adult Education
Types:
Translation Code
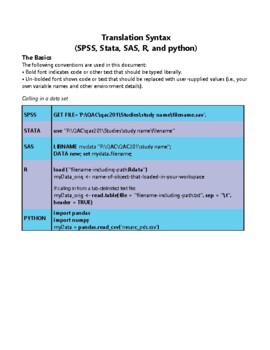
As part of our NSF-funded passion-driven statistics project, we have just started to share more widely our “translation code” aimed at supporting folks in learning code-based software and in moving more easily between them. The pdf includes all of the basic syntax for managing, displaying and analyzing data, translated across SAS, R, Python, Stata and SPSS. http://bit.ly/PDSTranslationCode.For more information about our warm and welcoming data-driven curriculum, check out https://passiondrivenst
Grades:
6th - 12th, Higher Education, Adult Education
Types:
R software Secondary Data Analysis Workshop (Introductory/AP Statistics)
This handout is intended for those interested in teaching/learning basic introductory statistics concepts to analyze real data. Students will learn how to tell a story using secondary data analysis. The handout is for R or R Studio, a free cloud based system and the US Longitudinal Study of Adolescent Health data set. For handouts on setting up a free R account, the data set code book and raw data file, a PowerPoint to accompany the handout, or questions please email kristin.flaming@gmail.com or
Subjects:
Grades:
6th - 12th, Higher Education, Adult Education
Types:
Showing 1-21 of 21 results

