40 results
Middle school graphing lessons for SMART Notebook
8th Grade Math Teachers Edition Smartboard Bundle
Have you ever wished you could have a teachers edition book on the Smartboard? Now you can! I have created a 277 page Smartboard Lesson that basically puts your teachers edition book on the wall. This file contains practice for Pythagorean Theorem, Nets, 3D Shapes, Algebraic Expressions, and much more. The layout has been designed similar to a smartphone where the homepage acts like a navigational tool to take you to the specific skills you desire. You can be redirected to the homepage from anyw
Subjects:
Grades:
6th - 10th, Staff
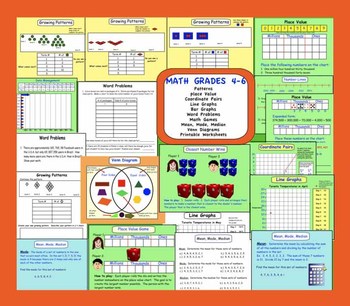
Interactive Smartboard Math Gr. 4-6 (patterning, graphing, venn diagrams)
This is an Interactive Smart Notebook 11 file. You MUST have Smart Notebook Software to download this file. There are 26 junior math pages. Pg 1-4 Growing patterns (interactive lessons and printable worksheets)Pg 5-6 Word problems (extending patterns)Pg 7-8 Place value Pg 9 Number linePg 10 Printable word problems (number sense)Pg 11-12 Place value interactive gamesPg 13-14 Interactive bar graphs (data management)Pg 15-16 Line graphs (interactive & printablePg 17-20 Coordinate pairs (inte
Subjects:
Grades:
4th - 6th
Engage NY (Eureka) 6th Grade Common Core Math Module 3-Topic A
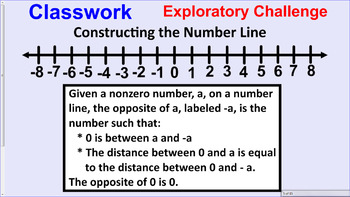
If you love Engage NY, but are looking for a more engaging way to teach the modules, you have come to the right place! This notebook file for SmartBoard follows the 6th grade Module 3-Topic A, Lessons 1-6. If you like these lessons, follow me for full topic notebooks for more topics, other modules and grade levels. Save time and energy while engaging students in common core math! These lessons cover understanding positive and negative numbers on the number line. Engage NY created the module
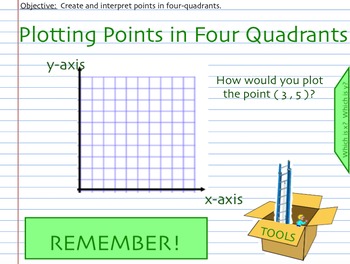
Plotting Points in Four Quadrants
In this interactive SMART Board lesson, students will learn how to plot points in all four quadrants. Students will also investigate the characteristics of points in various locations of the coordinate place (in each quadrant and on each axis). The notebook file also includes notes to the teacher that explains how to use each slide of the presentation and gives suggestions for its delivery.
Grades:
5th - 8th
CCSS:

SmartBoard Lesson on Graphing Linear Inequalities
This is an Algebra lesson for the SmartBoard on graphing linear inequalities and systems of linear inequalities. This Notebook file starts with reviewing the inequality symbols and how to graph an inequality on the number line. It then moves on to the definition of a linear inequality and how to graph one on the coordinate plane. The steps to follow are clearly identified and several example problems are provided. The second half of this lesson gives problems about solving systems of linear ineq
Subjects:
Grades:
8th - 12th, Higher Education, Adult Education
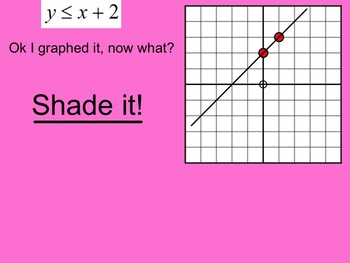
How I Teach Graphing and Writing Linear Inequalities
This is a 28 page Smartboard lesson explaining how to graph and write linear inequalities. The lesson includes step by step instruction along with multiple pages of practice. The practice pages also include the answers.
Grades:
8th - 10th, Higher Education
Engage NY (Eureka) 6th Grade Common Core Math Module 6-Topic A
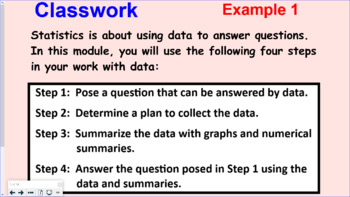
If you love Engage NY, but are looking for a more engaging way to teach the modules, you have come to the right place! This notebook file for SmartBoard follows the 6th grade Module 6-Topic A, Lessons 1-5. If you like these lessons, follow me for full topic notebooks for more topics, other modules and grade levels. Save time and energy while engaging students in common core math! These lessons cover understanding distributions. Engage NY created the modules, I made them easier to follow and
Subjects:
Grades:
6th
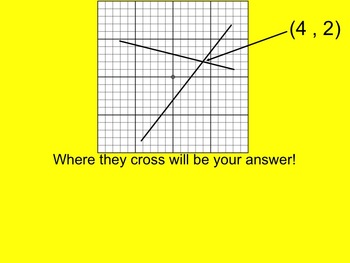
How I Teach Solving Systems by Graphing
This is a 20 page Smartboard lesson on how to solve systems of equations by graphing. The lesson gives step by step instructions and includes multiple practice pages. The practice pages also include answers.
Grades:
8th - 10th, Higher Education
Engage NY (Eureka) 6th Grade Common Core Math Module 3-Topic C
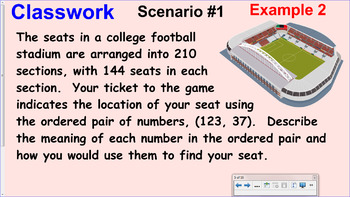
If you love Engage NY, but are looking for a more engaging way to teach the modules, you have come to the right place! This notebook file for SmartBoard follows the 6th grade Module 3-Topic C, Lessons 14 - 19. If you like these lessons, follow me for full topic notebooks for more topics, other modules and grade levels. Save time and energy while engaging students in common core math! These lessons cover rational numbers and the coordinate plane. Engage NY created the modules, I made them ea
Engage NY (Eureka) 6th Grade Common Core Math Module 6-Topic B
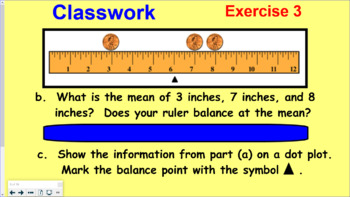
If you love Engage NY, but are looking for a more engaging way to teach the modules, you have come to the right place! This notebook file for SmartBoard follows the 6th grade Module 6-Topic B, Lessons 6 - 11. If you like these lessons, follow me for full topic notebooks for more topics, other modules and grade levels. Save time and energy while engaging students in common core math! These lessons cover summarizing a distribution that is approximately symmetric using the mean and mean absolut
Subjects:
Grades:
6th
SMARTBOARD lesson on locating points on a graph
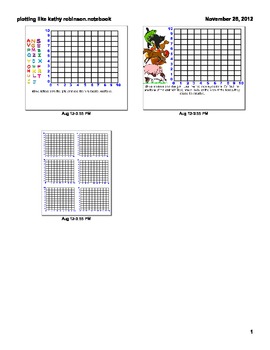
This smartboard lesson showcases how to find different locations on a coordinate plane. There are two activities included, one where you can drag and locate letters on a graph, and the other where you find the locations of parts of an animal on a graph. For the second, students could find where the horse's nose is on the graph, or the fish's tail.
Grades:
2nd - 6th, Adult Education
Engage NY (Eureka) 6th Grade Common Core Math Module 6-Topic D
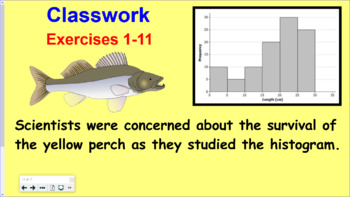
If you love Engage NY, but are looking for a more engaging way to teach the modules, you have come to the right place! This notebook file for SmartBoard follows the 6th grade Module 6-Topic D, Lessons 17 – 22. If you like these lessons, follow me for full topic notebooks for more topics, other modules and grade levels. Save time and energy while engaging students in common core math! These lessons cover summarizing and describing distributions. Engage NY created the modules, I made them eas
Subjects:
Grades:
6th

Engage NY (Eureka) 6th Grade Common Core Math Module 6-Topic C
If you love Engage NY, but are looking for a more engaging way to teach the modules, you have come to the right place! This notebook file for SmartBoard follows the 6th grade Module 6-Topic C, Lessons 12 - 16. If you like these lessons, follow me for full topic notebooks for more topics, other modules and grade levels. Save time and energy while engaging students in common core math! These lessons cover summarizing a distribution that is skewed using the median and the interquartile range.
Subjects:
Grades:
6th
SMARTBOARD lesson on graphing linear equations and slope intercept y-mx+b
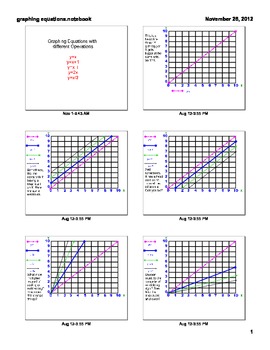
This smartboard lesson showcases how to graph linear equations using the slope-intercept formula. It explains how addition, subtraction, multiplication, and division all change the appearance of the lines made by graphing the equations. Several examples and some blank practice are provided.
Grades:
4th - 12th, Adult Education
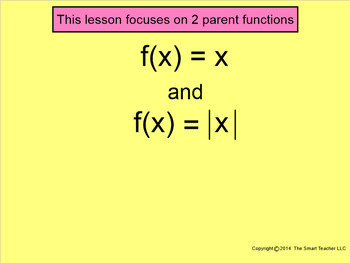
How I Teach Parent Functions and their Transformations
This is a 35 page Smartboard file on 2 Parent Functions and their transformations. The two parent functions in this lesson are linear equations and absolute value equations. The lesson explains shifting up, down, left, and right with examples and then there are a few that have a double move like 5 to the right and 3 down.
Subjects:
Grades:
7th - 10th

Pictograph & Bar Graph Helpful Hints Mini-Lesson
This Notebooksoft Software mini-lesson guides students through the interpreting of bar graphs ad pictographs. The lesson gives examples of each type of graphs and demonstrates hw to read the graphs and answer questions based on these types of graphs. The mini-lesson tackles tricky types of questions that students may encounter while reading graphs. This lesson fits with any bar graph and pictgraph lessons.
Subjects:
Grades:
K - 7th, Adult Education
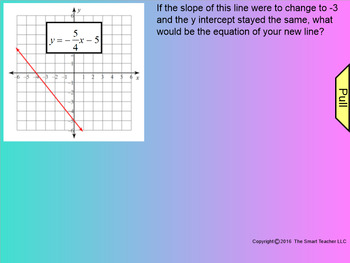
How I Teach Changing the Slope or "Y" Intercept
This is a 28 page Smartboard file about slope and y intercept changes. Students look at a graphed line before finding out if the slope or "Y" intercept gets changed. Then they have to decide what the new line will look like. If you want to know how well your students know y = mx + b this lesson will do it!
Grades:
7th - 10th

Solving Inequalities by addition & subtraction
This lesson explains how to solve inequalities by using addition and subtraction. Students reveal the answers with a fun "Magic 8 Ball"!
Grades:
6th - 10th
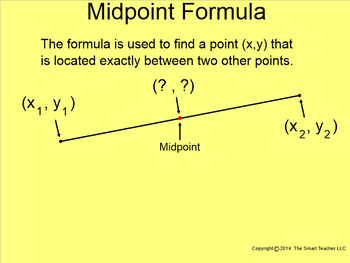
How I Teach the Midpoint Formula
This is a 41 page Smartboard file teaching the midpoint formula. Students learn the formula and how to use it to find the midpoint of a line. After several pages of practice the lesson then explains how to find one of the endpoints if the midpoint and the other endpoint is given.
Grades:
7th - 10th
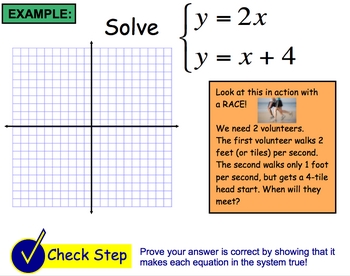
SmartBoard Lesson on Solving a System of Equations by Graphing
This is an Algebra lesson for the SmartBoard on solving a system of linear equations by graphing. This Notebook file starts with a warm-up problem which is later revisited in the lesson. The need to learn a method of solving a system is established, and the method of solving by graphing is discovered. This is followed by numerous examples of solving a system, which include activities for kinesthetic learners so they can more easily make connections. Special systems are also discussed and there a
Subjects:
Grades:
8th - 12th, Higher Education, Adult Education

How I Teach Proportional Relationships
This is a 29 page Smartboard lesson over Proportional Relationships. Students learn how to pick out proportional versus non proportional relationships by looking at graphs and by looking at x-y tables. I do not get into constant of variation and the use of a formula. I will save that for another lesson.
Subjects:
Grades:
6th - 9th, Staff
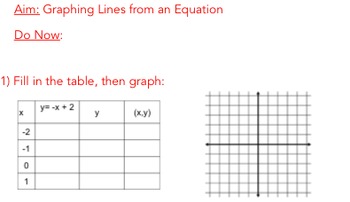
Graphing Lines from an Equation
In this smartboard lesson, students will review how to graph lines from an equation in y=mx+b, or slope-intercept form. First students will review how to graph a line using a table by substituting in values. Then, they will practice graphing a line by first identifying the y-intercept and then using the slope to graph several more points. A real-life application problem is also included, as well as examples where either the y-intercept or slope is zero.
Subjects:
Grades:
7th - 8th

SmartBoard Lesson on Standard Form of a Linear Equations
This is an Algebra lesson for the SmartBoard on the standard form of a linear equation. This Notebook file starts with an explanation about the fact that there are several forms of an equation of a line. It reviews the concept that only two points are needed to draw a line and different forms provide different information about the graph. It introduces that standard form allows you to easily find the x- and y-intercepts, then leads to an exploration activity where students discover how this is p
Subjects:
Grades:
8th - 12th, Higher Education, Adult Education
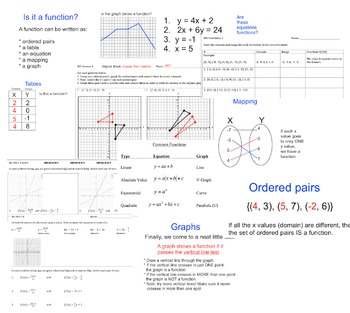
Complete presentation - Functions, inverses
This is a complete, 43 slide SMART Board presentation on functions. Teachers can walk though slide by slide, asking questions along the way to discover many different ways we can write and represent functions: ordered pairs, mapping, equations, graphing, etc.Teachers can print out activities on functions / inverses.1) Is it a function? Students look at domain and range to determine if sets of numbers are functions or not. Then they plot points to see if sets of ordered pairs pass the 'vertical l
Subjects:
Grades:
7th - 10th
Showing 1-24 of 40 results


