11 results
Middle school graphing interactive notebooks for SMART Notebook
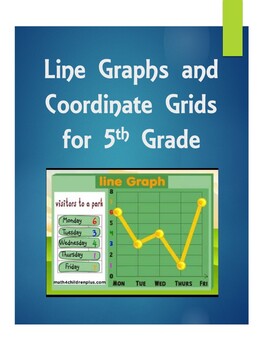
Line Graphs and Coordinate Grids for 5th Grade
Use this interactive Smart Notebook file to introduce your students to the vocabulary and parts of a coordinate grid. Activities include vocabulary review with dice, ideas for creating a line graph, plotting points on coordinate grids, and websites to use for practice in a whole group setting.
Grades:
5th - 6th
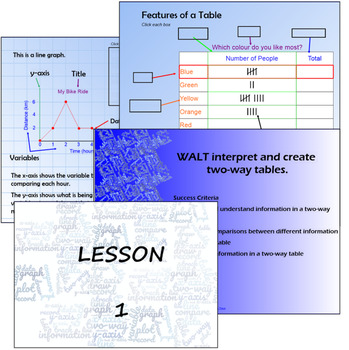
Data Lesson Sequence - 4 Lessons - Data/Statistics - KS2/Stage 3
Data lessons on tables, two-way tables and line graphs presented in Smart Notebook. It includes 4 lesson presentations including WALTs and Success Criteria in the slides, all ready to be used with your class. It gives some basics for a unit of work on data and it is fully editable. The aim of these lessons is to break down each data collection/displaying method into simple language so that it is easy to follow.Lesson 1 - Simple Data Tables. This goes through the features of a table and practice
Subjects:
Grades:
4th - 7th
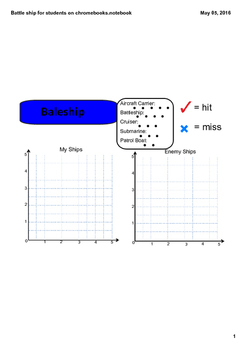
Grade 5 Math Module 4 lesson 4 Battleship -Student Use
This smartnotebook file is meant to use on individual ipads or chromebooks on smarttech express. The infinate cloner on the smart notebook file allows students to do this lesson electronically very easily with a laptop, tablet, etc.
Grades:
5th - 6th
Types:
CCSS:

An Introduction to Graphing Lines Using Slope and Y-Intercept- Grade 8 or 9
This smart notebook lesson introduces graphing lines using the slope and y-intercept. There are 16 total practice problems. The first few involve graphing with a table of values. The next few involve graphing by stating and using the slope and y-intercept. I have my students write the slope as a fraction with directions (ex: up or down/right or left) for each question when they are first learning this concept. I would print out the slides and have your students do the same. There are also
Grades:
8th - 9th
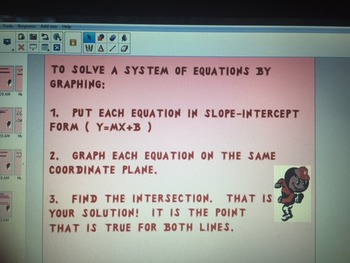
Solving Systems of Equations by Graphing
Students will solve systems of equations by graphing.
Subjects:
Grades:
8th
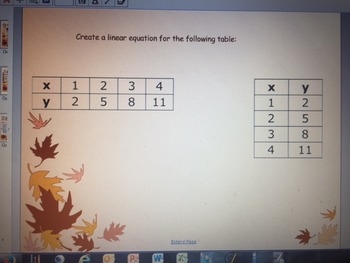
Different Representations of Linear Functions
Given a table, graph, context, or equation, students will find the other representations of the function.
Subjects:
Grades:
8th
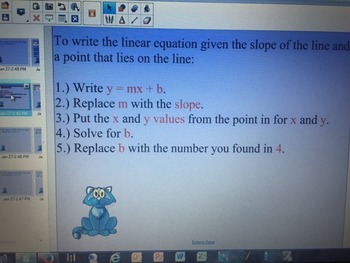
Write a Linear Equation Given a Point and the Slope or Given Two Points
Students will be able to write a linear equation given a point on the line and the slope or given two points on the line.
Grades:
8th
CCSS:
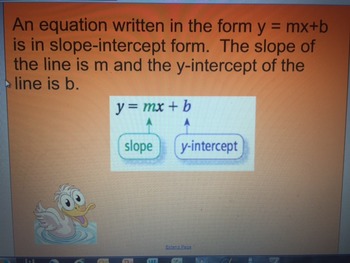
Graphing a Linear Function Given Slope-Intercept Form
Students will graph equations in slope intercept form.
Grades:
8th
CCSS:
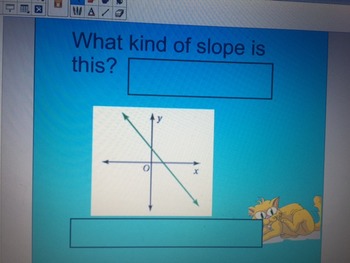
Slope
Students will be able to identify if the slope of a line is positive, negative, zero, or no slope. They will also be able to find the slope of the line. Lastly, students will be able to use the slope to answer questions in context.
Grades:
8th
CCSS:
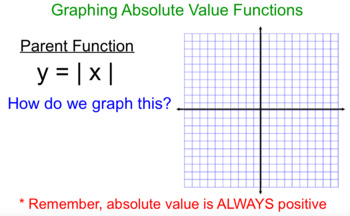
Graphing Absolute Value Function Notes
Editable Smart Notebook file on the process of graphing absolute value functions. Teacher-led with student practice problems included.
Grades:
7th - 10th
Showing 1-11 of 11 results


