1 result
Common Core 3.MD.B.3 resources for SMART Notebook and for homeschool

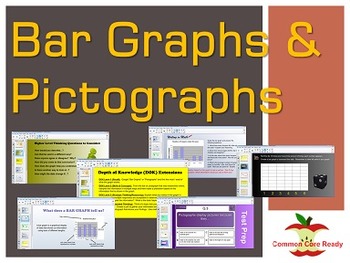
Bar Graphs & Pictographs for Measurement / Data for the SMART Board
Bar Graphs & Pictographs for Measurement / Data for the SMART BoardIn this SMART Board Common Core Bar & Pictograph lesson, students will create and draw a scaled picture graph and a scaled bar graph to represent a data set with several categories. Solve one- and two-step “how many more” and “how many less” problems using information presented in scaled bar graphs. For example, draw a bar graph in which each square in the bar graph might represent 5 pets.This interactive SMART Board less
Subjects:
Grades:
2nd - 4th
Showing 1-1 of 1 results

