3 results
Graphing Common Core 4.MD.B.4 resources for GATE

Graphing Our Class Time Capsule Project
Infuse authentic learning into your math classroom by having your students complete this PBL to represent their class in graphs. The project is organized around the central question: How can we tell people in the future about our class using graphs to be placed in a time capsule? Students will examine historical graphs then come up with important ideas about their class to represent in graph form. Once they come up with a plan, they will conduct surveys and create a variety of graphs. Throughout
Grades:
3rd - 6th

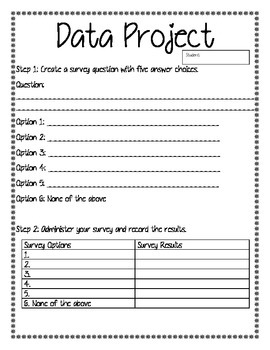
Data Project
Students create their own survey question and choices. After administering the survey, students use the data to create a line plot, bar graph, and pie chart. Then, they write a detailed summary of their data.

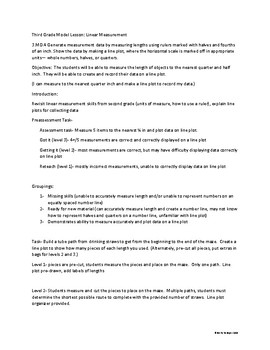
Tiered Lesson: Linear Measurement and Line Plots
Great hands on, problem based math lesson! This tiered lesson provides differentiated learning activities for students at three different levels of readiness- excellent for reaching learners at all different levels of ability. Students utilize measurement and problem solving skills to create solutions to mazes and display their solutions using line plots. Includes pre and post assessments, three levels of mazes, and lesson instructions. Levels 2 and 3 enrich and extend learning. Smart boar
Subjects:
Grades:
2nd - 4th
Showing 1-3 of 3 results


