14 results
Not grade specific Common Core 7.SP.A.1 resources
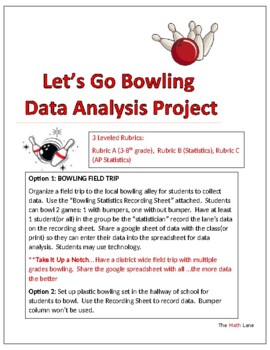
Let's Go Bowling Statistics STEM Project & Field Trip (3-12 and AP Stat)
Great END OF YEAR project. Get ready to strike up some fun with your students on a field trip to the bowling alley or right in your own hallway with a plastic bowling set! This isn't just any ordinary field trip - it's a real-world data collection extravaganza. 3 different leveled rubrics (Grade 4-10, Statistics, AP Statistics) so students can analyze the data based on their math knowledge. Students will be able to practice creating and analyzing graphical displays, scatterplots, construct c
Subjects:
Grades:
Not Grade Specific
Types:
Also included in: High School Statistics Project Bundle
Zombie Apocalypse Simulation Unit (Decision Making, Writing, STEM, and Math)
Oh no! You woke up to find that zombies have overrun the city! You will work in teams to make decisions and solve problems to survive.Each day, you will earn points based on the decisions you make. You will complete math, writing, and STEM activities on all six days.Included:Day 1: Introduction, weather-resistant STEM challenge, choose items to carry, a writing prompt, and determine the area available.Day 2: Find a secure location, zombie detection STEM, a writing prompt, and a math problem inv
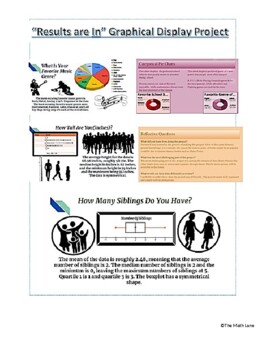
"The Results are In" Graphical Display Stats End of Year Project (All Grades)
Get ready to take your data analysis skills to the next level with our Graphical Display Project! Designed for students who want to create visually stunning displays of their data, this project allows you to not only collect data using Google Surveys, but also analyze and present it using Google Sheets. With detailed instructions, project examples, and a comprehensive rubric included, you'll have everything you need to create professional-looking graphical displays of both numerical and categori
Subjects:
Grades:
Not Grade Specific
Types:
CCSS:
Also included in: High School Math Projects (Algebra II and Statistics) STEM No prep
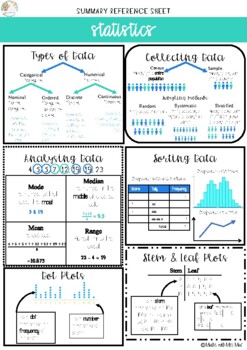
Summary Reference Sheet - Statistics
This product summarises key information when introducing statistics. Print and distribute to students to use as summary reference sheets while they work through the topic or display on your bulletin boards or classroom walls all year round. You and your students will find this simple yet informative cheat sheet easy to use!
Subjects:
Grades:
Not Grade Specific
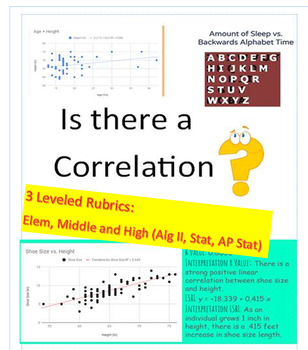
Correlation? Data Project (3 Rubrics_Elem/Middle School/ AP Stats) EOY
Get ready to supercharge your students' data analysis skills with this dynamic project! Perfect for end of year or semester project. In this engaging activity, students will have the exciting opportunity to collect their own data through surveys, online research, or real world data sets. They will then dive deep into the world of statistics as they determine if there is a correlation between two variables. With three different leveled rubrics, this project is perfect for students of all ages an
Subjects:
Grades:
Not Grade Specific
Types:
CCSS:
Also included in: High School Math Projects (Algebra II and Statistics) STEM No prep
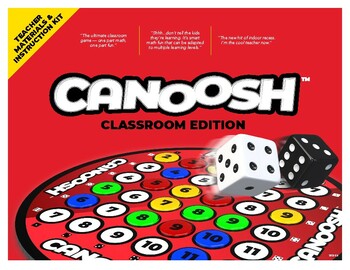
Canoosh Dice Probability Game — Complete (7 Games)
Canoosh is a collection of fast-action, easy-to-learn classroom dice games based on a simple two-dice probability chart. It was designed to be inclusive of any age/learning ability and integrates healthy competitive fun with a range of math learning concepts:Addition and subtractionFractionsProbability and statisticsStrategyCanoosh Classroom Edition is designed to be projected on a wall or chalkboard. You can use it with an entire class, divided into teams, in smaller group play, or as the new f
Subjects:
Grades:
Not Grade Specific
Types:

Teaching with Baseball Statistics
I use this activity to teach my science students how to model an idea using data. Students learn to predict the outcomes of a baseball pitcher based on their last 3 years of stats. Students learn to analyze their data and determine trends in the data. Students also learn to compare data from their pitcher to other students' pitchers (collaboration). Students also must be able to/learn to accurately graph their data. There is also a research component as students must research their pitcher's
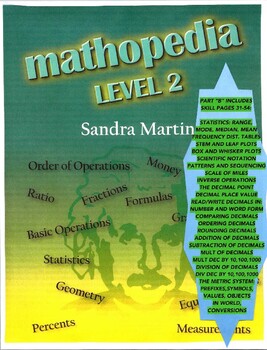
Mathopedia, Level 2, PART B, Skill Pages 31-54
Math made easy: Part B of Mathopedia, Level 2 contains the following skill pages: Statistics-Mode-Frequency Distribution Tables, Statistics-Range-Median-Mean, Stem and Leaf Plots, Box and Whisker Plots, Scientific Notation, Patterns and Sequencing, Scale of Miles, Inverse Operations, The Decimal Point, Decimal Place Value, Reading and Writing Decimals in Number Form, Reading and Writing Decimals in Word Form, Comparing Decimals, Ordering Decimals, Rounding Decimals, Addition of Decimals, Subtrac
Subjects:
Grades:
Not Grade Specific
Types:
CCSS:
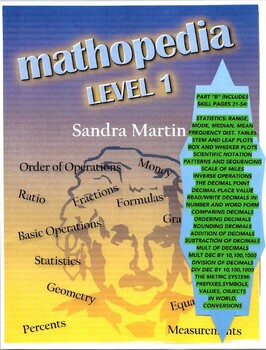
Mathopedia, Level 1, PART B, Skill Pages 31-54
Math made easy: Part B of Mathopedia, Level 1 contains the following skill pages: Statistics-Mode-Frequency Distribution Tables, Statistics-Range-Median-Mean, Stem and Leaf Plots, Box and Whisker Plots, Scientific Notation, Patterns and Sequencing, Scale of Miles, Inverse Operations, The Decimal Point, Decimal Place Value, Reading and Writing Decimals in Number Form, Reading and Writing Decimals in Word Form, Comparing Decimals, Ordering Decimals, Rounding Decimals, Addition of Decimals, Subtrac
Subjects:
Grades:
Not Grade Specific
Types:
CCSS:
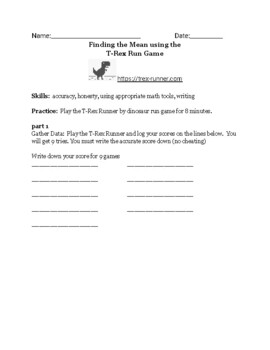
Finding the Mean/Average using Games
This activity is designed to have your students find the average or mean of a set of data. Also, what is the impact to the average by adding more scores to a skill based game. Students should have access to T-Rex Run Game https://trex-runner.comSkills taught are paying attention to accuracy. Students need to be honest when gathering data. They should use using appropriate math tools like a calculator when addition of several numbers will take just too long. Also, students will write using s
Subjects:
Grades:
Not Grade Specific
Types:
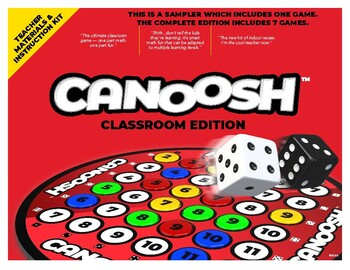
Canoosh Dice Probability Game (1-Game Sampler)
Canoosh is a collection of fast-action, easy-to-learn classroom dice games based on a simple two-dice probability chart. It was designed to be inclusive of any age/learning ability and integrates healthy competitive fun with a range of math learning concepts:Addition and subtractionFractionsProbability and statisticsStrategyCanoosh Classroom Edition is designed to be projected on a wall or chalkboard. You can use it with an entire class, divided into teams, in smaller group play, or as the new f
Subjects:
Grades:
Not Grade Specific
Types:
Tracking My Data: Goal-Setting Self-Assessment
Please write a review, even if it's just 2 words. I really appreciate it! This is a great way to get your students into tracking their own data and setting goals.Using this resource:students will track their data by standard (CCSS and GSE versions are included)set standard-specific goals for future assessmentstrack their progress towards meeting their goalsreflect on their learning (including strategies and next steps)Also included in this resource:a teacher's guide to using the resourcean optio
Grades:
Not Grade Specific
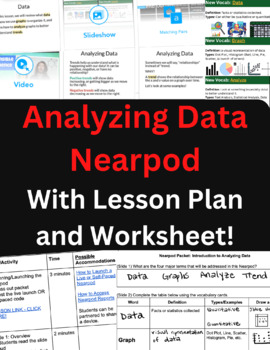
Analyzing Data Nearpod (Lesson Plan Included)
This Nearpod* activity is an introduction to analyzing data that works to either introduce the topic or review the key points. It starts by reviewing the two kinds of data (qualitative and quantitative) and common graphs (Line, Bar/Histogram, Dot Plots). Then it explores how to read a graph to see trends (positive/negative/no relationship) and gives students opportunities to practice reading graphs to identify whether there is a trend.What's Included:In addition to the Nearpod (9 slides), this d
Subjects:
Grades:
Not Grade Specific
Types:
NGSS:
MS-ETS1-3
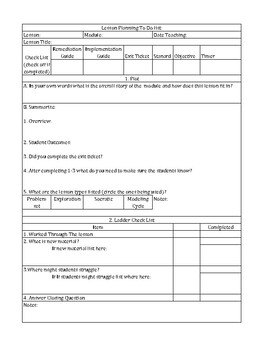
Eureka Math/Engage NY Lesson Plan Set Up and Reflection
Breaking down the lessons for Eureka Math or Engage NY can become daunting. With this CCSS aligned curriculum it is important that we stick to the lesson give with fidelity. However, this is not always easy to communicate on a lesson plan. I have take Eureka Materials and developed a lesson plan outline to help you create and implement your Eureka Math/Engage NY lesson plan.
Grades:
Not Grade Specific
Showing 1-14 of 14 results

