11 results
Statistics Common Core HSF-IF.B.4 resources
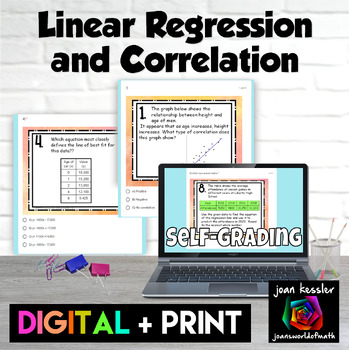
Linear Regression and Correlation Digital plus Print with TI-84 notes
This Linear Regression and Correlation activity is a great way for your students to practice their skills. There are 12 well chosen representative problems. Digital and printable PDF versions included. Questions include:CorrelationLine of Best FitProjecting TrendsFind the linear regression from a tableFind the linear regression from a scatter plotDetermining the correlation coefficientThe editable digital self checking version can be used as an Quiz, HW, or Paperless worksheet and is designed
Subjects:
Grades:
8th - 10th
Types:
CCSS:

High School Math 1: ENTIRE YEAR BUNDLE!
This is a $144 dollar value!
This bundle includes absolutely everything you need to teach the entire High School Math 1 year-long 9th grade course. There are 10 full units included in this bundle purchase, including all developing tasks, solidifying notes, practice activities, and assessments. These are the units included in this purchase:
Unit 1: Geometry and Rigid Transformations
Unit 2: Statistics and Interpreting Data
Unit 3: Expressions and Equations
Unit 4: Compound Inequalities and Abso
Subjects:
Grades:
8th - 10th
Types:
CCSS:
High School Math Performance Tasks Bundle
Performance Tasks are high-interest activities with real world math application. These are a great way to supplement your instructional tools to engage your students, develop critical thinking skills and make connections to the real world.
Now you can save time and money with this collection of High School Performance Tasks! This easy to manage bundle includes 66 Performance Tasks, which cover 100% of Topics for High School, and an index so you can quickly find a Performance Task that covers wh
Subjects:
Grades:
9th - 12th
Types:
CCSS:
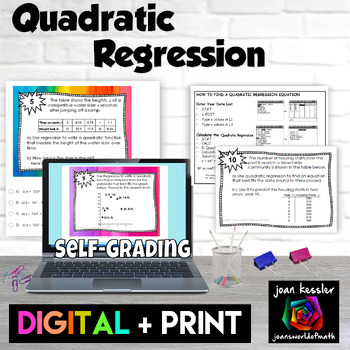
Quadratic Regression Applications Digital plus Print Activity plus TI-84 notes
This Quadratic Regression activity is a great way for your students to practice their skills finding the quadratic equation of best fit. There are 12 problems with both digital and printable PDF versions included. Questions include: Projecting TrendsFind the quadratic regression from a tableFind the quadratic regression from a scatter plotDetermining the R² coefficientApplications The editable digital self checking version can be used as an Quiz, HW, or Paperless worksheet and is designed with
Subjects:
Grades:
9th - 12th
Types:
CCSS:
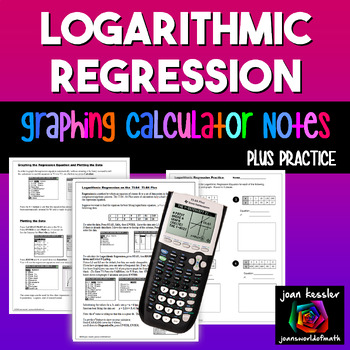
Logarithmic Regression TI Calculator Notes and Practice
This easy to follow reference guide plus practice set for Logarithmic Regression helps your students to effectively use the TI 84 Plus Graphing Calculator to determine a Logarithmic Regression Equation from data. They will learn to plot the data, find the logarithmic regression equation, graph the regression equation and the data plot simultaneously, and check validity using r². What's included? Two page illustrated reference guide with step by step directionsFour additional practice problems to
Subjects:
Grades:
9th - 12th
CCSS:
Data and Regression Project
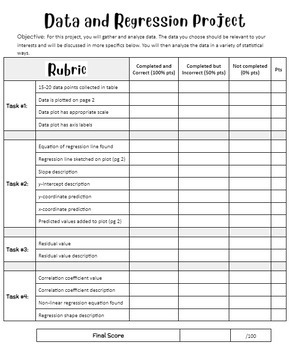
Sample includes directions. Actual product includes directions, rubric, and student worksheet. In this project students will generate a data set of two potentially correlated variables. They will then analyze this data with regression equations, residuals, and correlation coefficients. This is a great project to get to know what interests your students and a good chance for student collaboration. A great chance for PBL in the math classroom as well.
Subjects:
Grades:
9th - 12th
Types:
CCSS:
WORKSHEET / REVIEW - Writing & Graphing Linear Functions
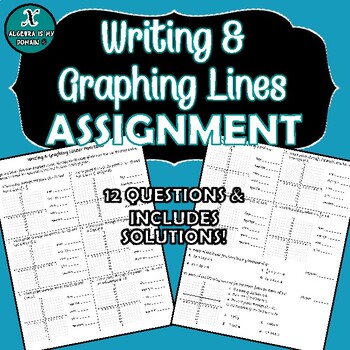
This worksheet can be used as additional practice, review, or a quiz on graphing lines. Students will be expected to graph a line given:A point and slopeTwo pointsAn equationStudents will then write the equation of the line in slope-intercept form and identify the features of the line (i.e. x-intercept, y-intercept, slope).It has a total of 12 questions, 2 of which are multiple-choice.Goes great with my Writing & Graphing Linear Functions Foldable Bundle!
Subjects:
Grades:
7th - 12th, Higher Education, Adult Education
Types:
CCSS:
Also included in: BUNDLE - FOLDABLES & ASSIGNMENT - Writing & Graphing Lines

Bundle G9-11 Polynomials - Home Value Performance Task
Bundle of 5 editions of Home Value Performance Task for 9th-11th grade
In the Home Value Performance Task, students use real home value data from cities and municipalities within their chosen state to practice modeling polynomials, assessing the fits of polynomial models, describing features of a graphed function in words, and to extend into evaluating polynomials for specific values, and solving polynomial equations all in an engaging, real world context. Students take on the role of a real es
Subjects:
Grades:
9th - 11th
Types:
CCSS:

BUNDLE - Performance Task – Scatterplots & Linear Functions – Commercial Slot
BUNDLE - Performance Task – Scatterplots and Linear Functions – Commercial Slot
Now you can get more options and save money with this collection of all editions of Commercial Slot!
This set includes the Commercial Slot Performance Task in 10 different TV series editions. If you were to purchase each of these Performance Tasks individually, it would cost $40. At only $7, this bundle saves you about 83% off retail price!
In the Commercial Slot Performance Task, students use authentic ratings d
Subjects:
Grades:
9th - 12th
Types:
CCSS:
Expected Value, Insurance, and the Lottery
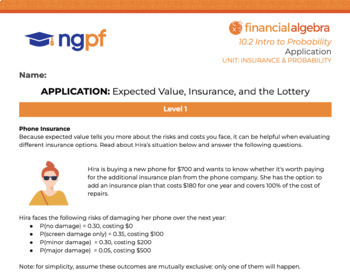
What do cell phone insurance, auto insurance, and the lottery all have in common? Well, your personal finances, for one, and the probability concept of expected value for the other! This three-tiered application problem set can be used to differentiate or scaffold the learning. Level 1 -- Help Hira decide if a $180 premium is worth it for her new $700 phone using expected value for mutually exclusive events Level 2 -- Read actuarial values from a table to determine likelihood and cost of car
Subjects:
Grades:
9th - 12th
Types:
CCSS:
Insuring Multiple Events with Compound Probability
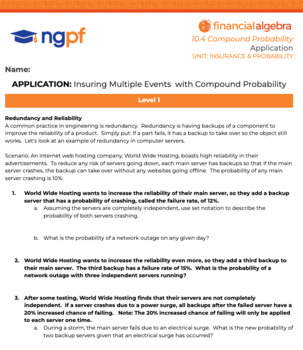
What do the Challenger explosion, internet redundancy, and car insurance have in common? They all hinge on calculating compound probability and distinguishing between independent and dependent events. This three-tiered application problem set can be used to differentiate or scaffold the learning. Level 1 -- Use compound interest to calculate the probability of an internet outageLevel 2 -- Compare car insurance premiums using expected valueLevel 3 -- Explore how insurance companies set their pri
Subjects:
Grades:
9th - 12th
Types:
CCSS:
Showing 1-11 of 11 results


