6 results
Statistics Common Core HSA-SSE.A.1 resources

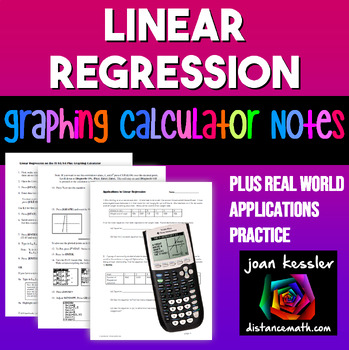
Linear Regression | TI-84 Graphing Calculator plus Applications
This clear, concise, step by step notes help your students use the TI 83 and TI 84 Graphing Calculator to enter data into lists, create a linear regression equation and to plot the equation along with the data simultaneously. Also included is a 3 page worksheet with five real world examples for students to practice. Solutions included. These can be used as Binder Notes or printed smaller for Interactive Notebooks._________________________________________________Related Products★ Quadratic Re
Subjects:
Grades:
9th - 11th, Higher Education
Types:
CCSS:
Also included in: Linear Functions and Systems Algebra 2 Unit 2 Activity Bundle

High School Math Performance Tasks Bundle
Performance Tasks are high-interest activities with real world math application. These are a great way to supplement your instructional tools to engage your students, develop critical thinking skills and make connections to the real world.
Now you can save time and money with this collection of High School Performance Tasks! This easy to manage bundle includes 66 Performance Tasks, which cover 100% of Topics for High School, and an index so you can quickly find a Performance Task that covers wh
Subjects:
Grades:
9th - 12th
Types:
CCSS:

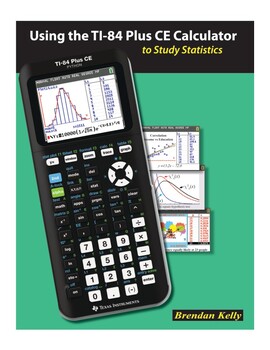
Using the TI-84 Plus CE Graphing Calculator to Study Statistics
Using the TI-84 Plus CE Calculator to Study StatisticsISBN 978-1-895997-59-0(102 pages; 8.5” x 11” trim size)The information age has made statistics one of the most important branches of mathematics. The ubiquity of real-world data enables us to explore statistical concepts using real data from interesting and current sources. As they work through the exercises in this book, students enter real data onto spreadsheets or into statistical plots on the TI-84 Plus CE Calculator while you guide their
Subjects:
Grades:
10th - 12th, Higher Education
Types:
CCSS:

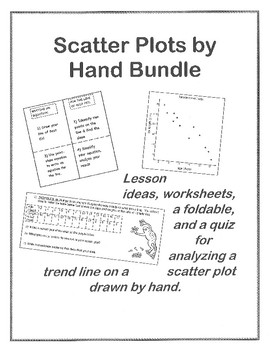
Scatter Plots, Trend Lines, Trend Line Equations by hand Lesson
UPDATED: This is the full lesson I used with my students in Algebra One. We start by creating a scatter plot with our tadpole data and drawing a trend line. Then we use the skills learned in the last unit (linear functions) to create an equation for the trend line. This is all done "by hand" as opposed to using technology. This lesson includes the interactive notebook foldable (also available by itself as a separate product on TPT), a homework worksheet with two sets of data, and a quiz. All ans
Subjects:
Grades:
8th - 10th

A Fishy Situation: Exponential Modeling Project
Students will explore exponential modeling as they analyze the 3 different fish populations along the Columbia River. Students will use the data given to notice trends, determine a regression equation that best fits the data and analyze the equations to make predictions and summarize the populations. Students will compare linear and exponential functions, as one population represents a linear model, one represents exponential growth and one represents exponential decay. Students will then be tas
Subjects:
Grades:
9th - 12th
Types:
CCSS:

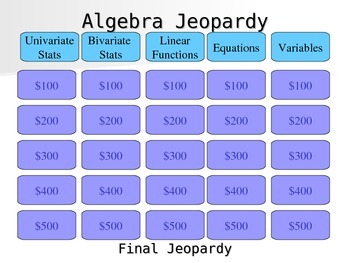
Algebra Jeopardy
This is a great way to review before an exam. This interactive powerpoint Jeopardy game asks questions with varying degrees of difficulty that students can choose. The topics include univariate and bivariate statistics, linear functions, equations and manipulating variables. I usually have my students work in teams and any group that gets the right answer when time is up, gets the points. This encourages students to keep working even if they aren't the fastest in the class. My students really re
Subjects:
Grades:
7th - 10th
Types:
CCSS:
Showing 1-6 of 6 results


