7 results
Measurement Common Core 4.NF.A.1 resources for Microsoft PowerPoint
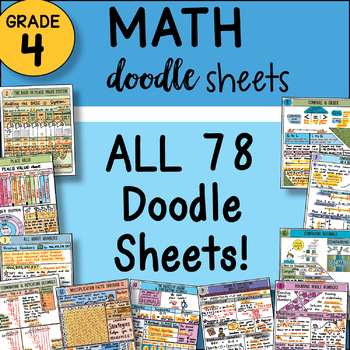
4th Grade Math Interactive Notebook ALL the DOODLE Sheets ~ So EASY to Use!
These Doodle Flat Sheets are the SAME CONTENT as my4th grade Foldables - just in a FLAT Sheet form. They work with the foldables as a review if you already own the foldables.Use them as a reteach or a review!These flat sheets are NOT in the ALL YEAR SET for 4th grade.This download includes:78 Math Doodle Sheets - covering the FULL YEAR of Math78 Guided Practice Sheets to check for understanding of each concept78 PowerPoints to show the key to the doodle sheets and the guided practice!* Two versi
Subjects:
Grades:
3rd - 5th
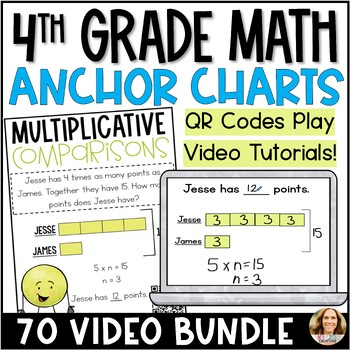
4th Grade Math Digital and Printable Anchor Charts with Video Tutorials
Do your students tend to forget 4th grade math concepts after you've taught them? Do you panic when students are absent over long periods of time and are stretched so thin that you don't have the time to reteach what they missed or forgot? If so, these printable and digital anchor charts are for you!These anchor charts are unique because they have embedded video tutorials within them and are shareable with students! ❤️My students are trained to watch the videos BEFORE asking for my help, making
Subjects:
Grades:
4th
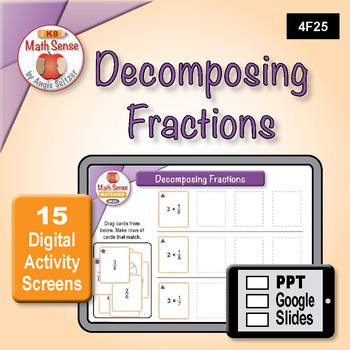
Decomposing Fractions DIGITAL MATCHING: 15 PPT / Google Slides 4F25
Kids can sort and match cards for decomposing fractions with this digital activity. By sorting cards with various expressions and models, kids will learn to make sense of fractions! And you'll be in complete control of each PPT file and can upload directly to your Google Drive as Slides. Kids love matching cards! WHAT YOU WILL GET• 15 PowerPoint Slides - Import Easily as Google Slides• Recording Worksheet & Answers• Make Your Own Activities (MYOA) PPT with 40 Card Images • 15 PPT Slides with
Subjects:
Grades:
4th - 5th
Fractional Line Plot Data
A straight forward PowerPoint lesson to help students navigate interpreting line plot data, specifically with fractions and mixed numbers. This has been a staple in my classroom for multiple years! Students will be learning about line plots in general, plotting data, and interpreting the data to answer questions. There are also challenging questions like adding up the total amount of rainfall in a month. These types of questions use critical thinking skills forcing students to differentiate be
Subjects:
Grades:
3rd - 5th
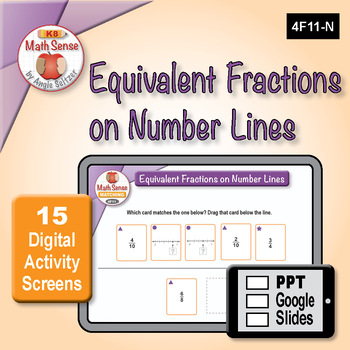
Equivalent Fractions Number Line DIGITAL MATCHING: 15 PPT / Google Slides 4F11-N
Kids can sort and match cards for equivalent fractions on number lines with this digital activity. By sorting cards with various expressions and models, kids will learn to make sense of fractions! And you'll be in complete control of each PPT file and can upload directly to your Google Drive as Slides. Kids love matching cards! WHAT YOU WILL GET• 15 PowerPoint Slides - Import Easily as Google Slides• Recording Worksheet & Answers• Make Your Own Activities (MYOA) PPT with 40 Card Images • 15
Subjects:
Grades:
4th - 5th
CCSS:

4th Grade MATH Common Core Spiral Review 7
This is the 7th (& final) set of spiral reviews I use with my 4th grade students (I normally use this during the middle of the 4th 9 weeks). It spirals converting measurement, time, rounding, writing equations, simplifying fractions, and many other skills (as this set includes a true/false section and a define the word section that has materials from all standards). This colorful spiral can easily be printed 2 to a page for students to work out as a hard copy. Could be used whole group or as
Subjects:
Grades:
4th - 5th
Line Plot Candy Activity
The students will collect their own data, round time, demonstrate the data in a line plot and answer questions about the line plot. Give each student a small piece of hard candy such as a Red Hot or a Mini Fruit Sour. They time the length it takes to finish the candy by writing down the time from the board or a clock. Next, students round their time to the nearest quarter, half or whole minute and create a line plot using the class's data. Questions are provided for students to answer based on
Subjects:
Grades:
4th - 7th
Showing 1-7 of 7 results


