27 results
Measurement Common Core 7.SP.A.1 resources
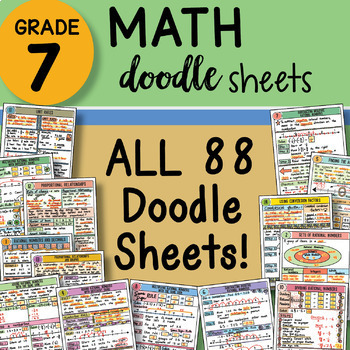
7th Grade Math Interactive Notebook DOODLE SHEETS ~ with PowerPoints
7th Grade Math Doodle Sheets ALL YEAR SET1-88 doodle sheets completed - see preview for all the colorful sheets!Each doodle sheet + guided practice sheet (88 total) sold separately for $3 each. All 88 sheets total $264. SAVE BIG and buy this ALL YEAR SET here for just $59! THIS PRODUCT includes: 88 Math Doodle Sheets (student blanks and keys) 88 Guided Practice Sheets (student blanks and keys) 88 PowerPoints – to show students the KEY – two versions of both sheets included: I
Subjects:
Grades:
6th - 7th
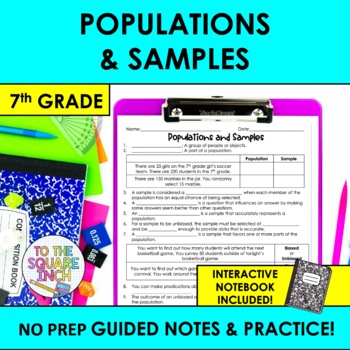
Populations and Samples Notes & Practice | + Interactive Notebook Format
Searching for an effective way to teach your students finding biased and unbiased samples and populations? These NO PREP guided notes are a classroom proven resource that will save you time and have your students proficient in finding biased and unbiased samples and populations in no time! With a comprehensive design, these notes offer a structured approach that can be differentiated for every level of learner. Guided notes are an effective teaching model that maximize your students ability to u
Subjects:
Grades:
6th - 8th
CCSS:
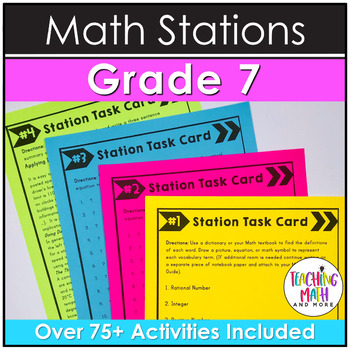
Math Stations 7th Grade Bundle
Ready to use math stations in your classroom? This Middle School Math Station Bundle is a COMPLETE BUNDLE covering ALL 7th grade math skills and standards! These Math Station activities are easy to PRINT & GO and engage your students. A must-have set for any seventh grade Math teacher to start using math stations in their classroom or easily adaptable to any Math Stations program you already have!SAVE 20% when you buy the bundle!Easy to incorporate into your math workshops. Students will lov
Subjects:
Grades:
7th
Types:
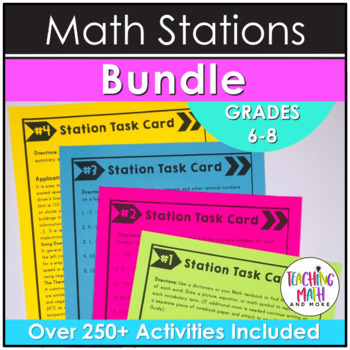
Math Stations Middle School Bundle
Do your students love independent math stations? These math stations are great for practice and math skills review. A COMPLETE MIDDLE SCHOOL BUNDLE covering all 6th, 7th, & 8th grade math standards! There is NO PREP needed. Just print each math station activity and go teach today! Easy to incorporate into your math workshops. Students will love learning and independently working at each math station. All math skills are covered in the middle school math stations. Here's what you'll get: 44 M
Subjects:
Grades:
6th - 8th
Types:
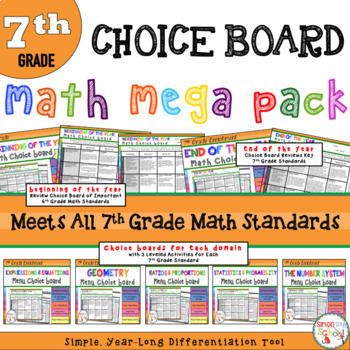
Math Choice Board Mega Bundle - All 7th Grade Standards - Distance Learning
Math Choice Board Mega Pack – All 7th Grade Standards – Year Long – This choice board bundle is a simple, year-long differentiated tool for ALL 7th grade standards.This resource includes… - Beginning of the Year Math Review Choice Board – 7th Grade - Expressions and Equations Enrichment Choice Board – Seventh Grade - Geometry Enrichment Choice Board – Seventh Grade - Ratios and Proportions Enrichment Choice Board – Seventh Grade - The Number Systems Enrichment Choice Board – Seve
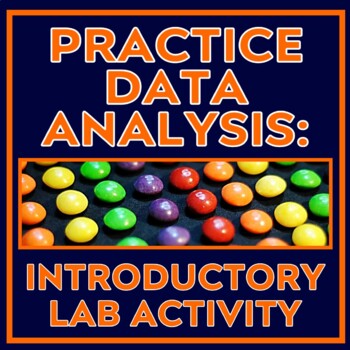
Scientific Method Activity Practice Data Analysis Qualitative and Quantitative
This activity has students collect QUALITATIVE and QUANTITATIVE DATA about the candy in a mixed pack, such as Skittles or M&Ms. There are many candy activities out there, but none quite covered the quantitative and qualitative skills I wanted my middle school students to practice, so I designed my own! This lab is designed to be simple so that students can master beginner lab and data collection skills.In this activity, students will:READ an article about the differences between qualitativ
Subjects:
Grades:
6th - 8th
Types:
Also included in: Introduction to Experimentation Activity Set for Middle School Science
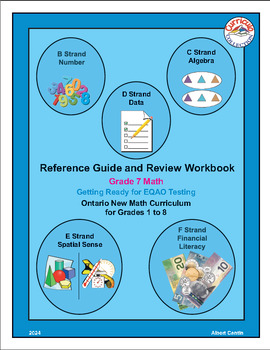
I07N-Ontario New Math Curriculum, Grade 7
About this Reference Guide and Review Workbook… Grade 7 is a transitional year in Ontario, as students leave the junior division and enter the intermediate division. In an effort to further improve their math skills, the following Reference Guide and Review Workbook has been developed in the most practical and straightforward way possible. Here, in short, is the simplified plan for the development of this document. The Ministry of Education guide’s 53 specific expectations, strands B to F, in t
Subjects:
Grades:
7th - 8th
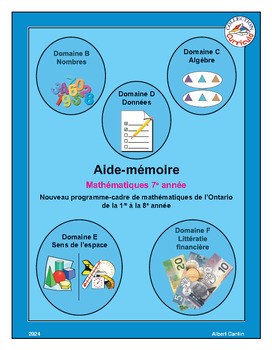
I07N-Nouveau programme-cadre de mathématiques de l’Ontario, 7e année
À propos de cet aide-mémoire… La 7e année est une année transitoire en Ontario puisque l’élève laisse le cycle moyen pour s’acheminer vers le cycle intermédiaire. Dans le but d’aider l’élève à faciliter cette transition et à se familiariser davantage en mathématiques, l’aide-mémoire qui suit a été élaboré de façon à le rendre le plus pratique et le plus simple possible. Les 53 contenus d’apprentissage des domaines B à F du guide du ministère de l’Éducation Le nouveau programme-cadre de mathémat
Subjects:
Grades:
7th - 8th
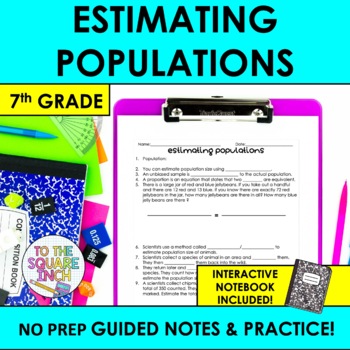
Estimating Populations Notes & Practice | + Interactive Notebook Format
Searching for an effective way to teach your students how to estimate population? These NO PREP guided notes are a classroom proven resource that will save you time and have your students proficient in estimating population in no time! With a comprehensive design, these notes offer a structured approach that can be differentiated for every level of learner. Guided notes are an effective teaching model that maximize your students ability to use working memory to focus on content, rather than copy
Subjects:
Grades:
6th - 8th
Relative Frequency Probability PowerPoint Lesson - Distance Learning
This 14-page editable PowerPoint lesson covers understanding relative frequency probability, how to calculate it, the difference between theoretical probability and relative frequency, and applications of relative frequency. Multiple examples, a student partner activity, and “Your Turn” slide ensures that students have a firm understanding of the lesson before moving on. This PowerPoint is formatted for widescreen display. The cover page was reformatted to make viewing easier when searching f
Subjects:
Grades:
6th - 9th
Also included in: Middle School Math PowerPoint Bundle - Distance Learning
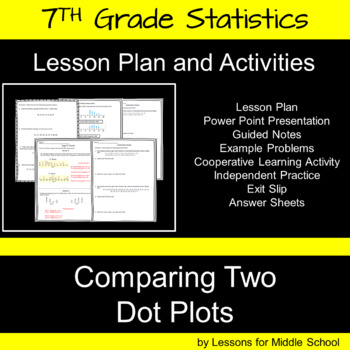
7th Grade Math -Statistics- Comparing Data Shown in Dot Plots
This lesson teaches students how to Compare Data Shown in Two Dot Plots according to the 7th Grade Common Core Math Standards. Students will be presented with data displayed in Dot Plots and students must use measures of central tendency to compare the data to formulate conclusions. Students will examine the spread or statistical range of the data, the center or median, and then they will examine the overall shape of the two dot plots. ABSOLUTELY NO PREP REQUIRED, just download and start teac
Subjects:
Grades:
6th - 8th
CCSS:
Also included in: 7th Grade Math - Probability and Statistics Bundle
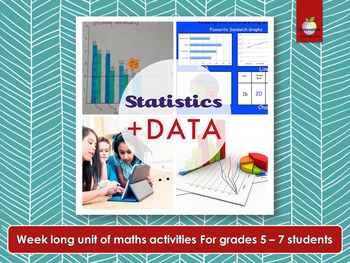
Statistics & Data Math Unit | Project Based Learning | Mean, Median, Mode, Range
Make math relevant and engaging for your students with the elementary/primary STATISTICS and DATA PROJECT. This NO PREP, this hands-on PROJECT-BASED LEARNING, will keep your class busy learning about MEAN, MEDIAN, MODE and RANGE for a whole week.COVERINGHow to ask and survey an “essential question.”Data collection methodsDrawing mathematical conclusions from dataPresenting data in graphs and tablesPresenting data and conclusions to peersThis insightful project makes a great, lively introduction
Subjects:
Grades:
5th - 7th
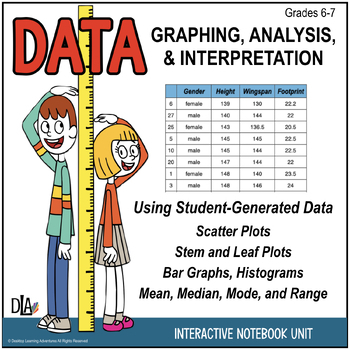
Data Graphing & Interpreting Data - Stem & Leaf, Mean, Median, Mode INB
Why use some meaningless data set from a textbook when you have a built-in generating source - your students! This engaging set of graphing and plotting activities starts with your students measuring their heights, footprints, and wingspans. These student-generated measurements are then used to build scatter plots, stem & leaf plots, and histograms - a terrific way to bring data analysis to life. With more than a dozen activities and extensions included, this is an Interactive Notebook (IN
Subjects:
Grades:
6th - 7th
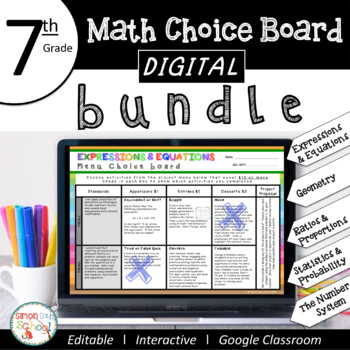
7th Grade DIGITAL Math Choice Board Bundle for Distance Learning
7th Grade DIGITAL Math Enrichment Choice Board Bundle – EDITABLE – NO PREP These editable DIGITAL choice boards for Google Drive™ are an amazing differentiation tool that not only empowers students through choice but also meets their individual needs. It is the perfect resource for distance learning. This digital resource includes all four of my 7th grade math enrichment choice board menu projects from Math Enrichment Choice Board Bundle – All Seventh Grade Standards - Geometry - Expressions an
Subjects:
Grades:
7th
Types:

Data Scavenger Hunt
This activity has students look at questions and determine which graph will give them the information that they need. Great as a scavenger hunt activity. This activity forces students to read the title of the graph and interpret what they are reading.
Subjects:
Grades:
3rd - 7th
Types:
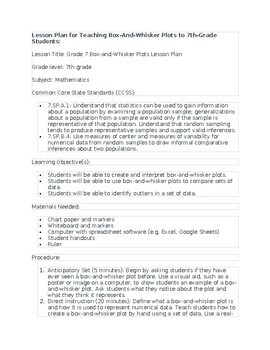
Title: Grade 7 Box-and-Whisker Plot Lesson Plan and Assessment
Discover our Grade 7 Box-and-Whisker Plots Lesson Plan and Assessment! Aligned with CCSS for Mathematics, this comprehensive resource equips 7th-grade students with the skills to create and interpret box-and-whisker plots. This product promotes active learning and critical thinking with a detailed lesson plan, materials, differentiation strategies, and an assessment. Engage your students and deepen their understanding of data analysis. Download now for efficient and effective teaching!CCSS-Align
Subjects:
Grades:
6th - 7th
Types:
Video: Measures of Central Tendency: The Mean and Normally Distributed Data
In this video tutorial students learn about normally distributed data and how to identify the population mean from the normal distribution. Standard deviation is briefly introduced. Includes three real-world examples.
Subjects:
Grades:
6th - 10th
CCSS:
Also included in: Video Bundle: Measures of Central Tendency
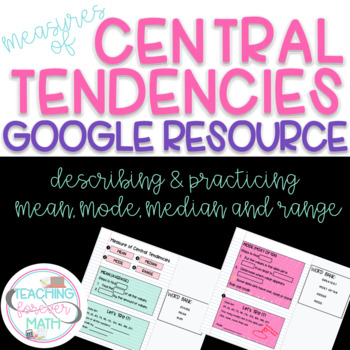
Measures of Central Tendencies Notes - GOOGLE - Distant Learning
Describing & practicing mean, mode, median and range.Digital interactive notes on Google Slides that incorporate matching for steps to solve. Practice for each term which can be checked using Google Forms.
Subjects:
Grades:
6th - 8th
Types:
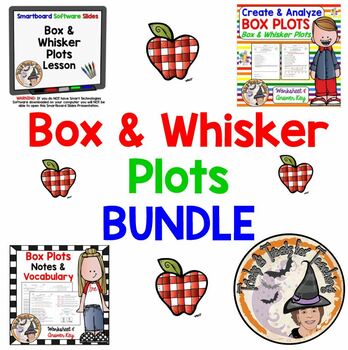
Box & Whisker Plots Smartboard Slides Notes Worksheet BUNDLE
Teachers ~ are you interested in SAVING $$$ MONEY? Then purchase this BUNDLE! Fabulous Box-and-Whisker-Plots Smartboard-Slides-Lesson, Notes-with-Practice,-and-Worksheet too! Your students will love this, and you'll enjoy using it year after year!Be sure to L@@K at my other 1,225+ TERRIFIC teaching resources!~ ~ THANK YOU KINDLY ~ ~
Subjects:
Grades:
6th - 8th
Video Tutorial: Measures of Central Tendency: Weighted Mean
In this video tutorial students extend their understanding of mean by looking at examples of weighted means (sometimes referred to as weighted averages). Includes three real-world examples.
Subjects:
Grades:
6th - 10th
Also included in: Video Bundle: Measures of Central Tendency
Video Tutorial: Measures of Central Tendency: Mean of a Probability Distribution
In this video tutorial students learn about the mean of a probability distribution. Includes a brief discussion of expected value, plus a brief tie-in to weighted means. Includes three real-world examples.
Subjects:
Grades:
6th - 10th
CCSS:
Also included in: Video Bundle: Measures of Central Tendency
Video Tutorial: Measures of Central Tendency: Sample Mean
In this video tutorial students learn about sample mean from a random sampling of data. All examples involve normally distributed data with a known population mean and standard deviation. Includes three real-world examples.
Subjects:
Grades:
6th - 10th
CCSS:
Also included in: Video Bundle: Measures of Central Tendency
Video Tutorial: Measures of Central Tendency: Finding the Median of a Data Set
In this video tutorial students learn how to find the median of a data set. The mean is also calculated so that students can learn similarities and differences between these two measures of central tendency. Includes three real-world examples.
Subjects:
Grades:
6th - 10th
Also included in: Video Bundle: Measures of Central Tendency
Video Tutorial: Measures of Central Tendency: Finding the Mode of a Data Set
In this video tutorial students learn how to calculate the mode of a data set, as well as how the mode differs from the mean and median.Includes three real-world examples.
Subjects:
Grades:
6th - 10th
Also included in: Video Bundle: Measures of Central Tendency
Showing 1-24 of 27 results


