10 results
Graphing Common Core K.MD.A.2 resources for Microsoft PowerPoint
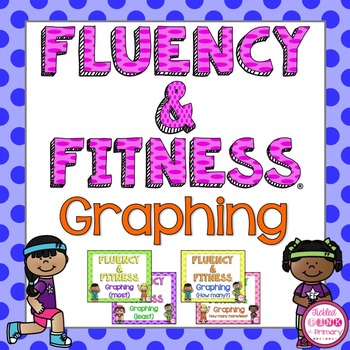
Graphing Fluency & Fitness® Brain Breaks
Fluency and Fitness® are some of the top selling brain breaks and movement activities on TPT! This activity helps your students moving, while practicing graphing. This bundle includes 4 slideshows to help your students learn basic graphing skills. Each slideshow has a variety of exercises for students to do. This bundle is included in my Math Fluency & Fitness Bundle and my Fluency & Fitness MEGA Bundle which is a growing bundle. Click on the preview file to see some examples or click h
Grades:
K - 1st
Also included in: Fluency & Fitness® Brain Breaks MEGA BUNDLE (K-2)
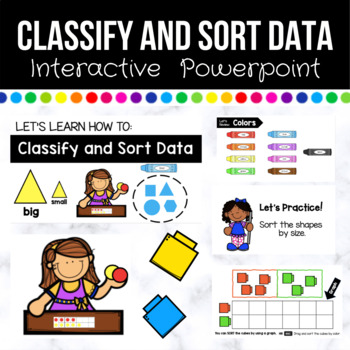
Classify and Sort Data Interactive Powerpoint (Distant Learning Compatible)
Teaching students how to classify and sort data during school closure can be challenging, that is why I made this interactive PowerPoint! This Powerpoint goes over how to classify objects my color, shape, and size and how to sort them. The PowerPoint goes over various lessons covering a full chapter of GoMath (12). Included Lessons:- Classify and Count by Color- Classify and Count by Shape- Classify and Count by Size- Make a Concrete Graph- Problem Solving: Read a Graph** Interactive slides for
Grades:
PreK - 1st
Types:
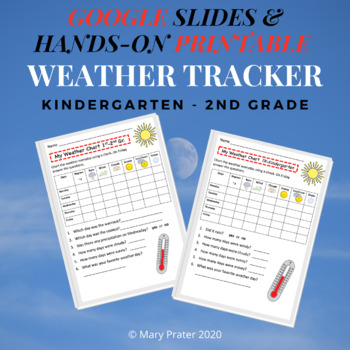
BUNDLE - Grade Weather Chart for Kids Printable & Google Slides
This Weather Chart for Kids Printable & Google Slides combines the Printable and Digital Google slides product of the Kindergarten-2nd grade Weather Tracker Chart for Kids. Please read the directions and comments for the attached products. KEYWORDS: weather chart, weather tracker, kindergarten weather tracker, Google slides weather tracker, Kindergarten-2nd grade Weather Tracker Chart for Kids, track the weather, chart the weather, explore the weather, keep track of weather conditions, hands
Subjects:
Grades:
K - 1st
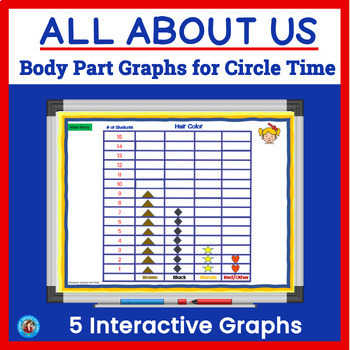
All About Me: Interactive Graphs for PreK - K Circle Time - Language & Math
Enhance circle time with these engaging interactive body part graphs! Ideal for Back to School and the topic of ALL ABOUT ME, this digital product features 5 interactive graphs for hair color, eye color, hair length, boy vs. girl, and missing teeth. You and your class are guaranteed to have fun as you learn about body parts, colors, shapes, quantity (more/less, most/least), and counting to 15.Contents of Body Part Graphs for Circle Time1. Interactive PowerPoint activity with 11 slides.2. Five in
Subjects:
Grades:
PreK - K
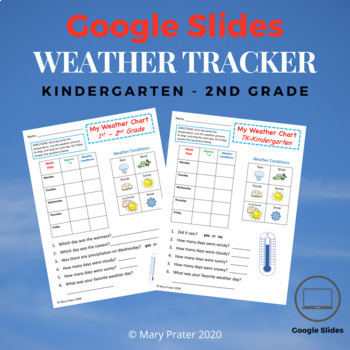
Kindergarten - 2nd Gr. Weather Chart for Kids GOOGLE SLIDES
This is a GOOGLE SLIDES weather chart for kids. It contains 2 different slides. One is for TK-Kindergarten and the other is suitable for 1st-2nd grade. It has a weather chart with boxes to write the daily temperature. This weather chart for kids is a great way to keep track digitally. It has moveable clipart to drag and drop into the weather condition boxes. When the week of tracking the weather is completed students can answer the questions below. There are highlight boxes to type in the answer
Subjects:
Grades:
K - 2nd
Also included in: BUNDLE - Grade Weather Chart for Kids Printable & Google Slides
Interpreting Graphs and Charts - Lesson on Bar Charts and Visual Data
Lesson on interpreting bar graphs. 25 slides with multiple choice questions asking students to interpret the difference between lines on bar graph. Would be appropriate for 4th to 5th grade. Slides are animated and include colorful pictures and graphics.
Subjects:
Grades:
4th - 5th
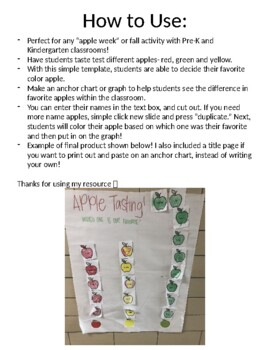
Apple Tasting Graph Template
Easy template for apple tasting graph! Put your students' names in the apples and let them decide which color apple they liked the best. Included with instructions and an example from my classroom of the finished project. Simple and easy!
Grades:
PreK - K
Types:
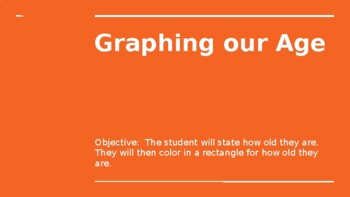
Editable Graphing Your Age
This is an online way to graph students ages. This item is editable. You can type in names, add pictures, and change the age groups. This is a great way to engage your online learners with something personalized to them, yet still teach graphing.
Subjects:
Grades:
PreK - K
Types:
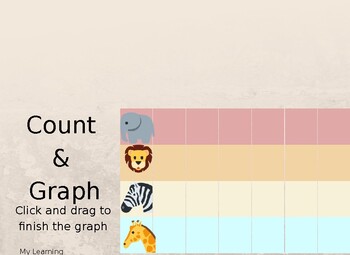
Learn from Home Count and Graph
Use this PowerPoint to click and drag the pictures to build a pictograph. Analyze and interpret the information on the next slide. Great for distance learning.
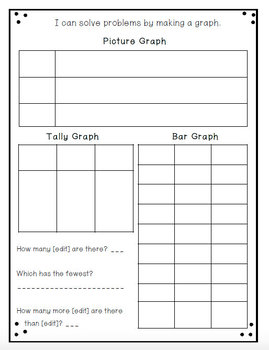
MINI ERASER Graphing {EDITABLE!}
Do you love mini erasers as much as I do? Then this product is PERFECT for using these adorable manipulative to graph! Assort up to three different kinds of mini erasers in a baggie or cup and have your kiddos decipher the results! My first graders loved using these in a math center and in both large and small groups.
**Font used for PowerPoint is First Grade Scoop Cherry on Top
https://www.teacherspayteachers.com/Product/FREE-Fonts-for-Personal-and-Commercial-Use-CU-The-First-Grade-Scoop-5898
Showing 1-10 of 10 results


