10 results
Graphing resources for Easel Activities on sale
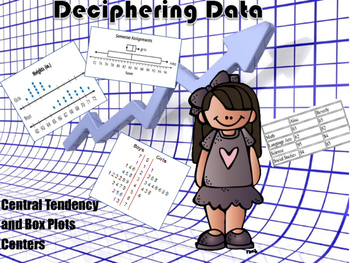
Central Tendency & Box Plots Centers with Mean Absolute Deviation
This is a collection of centers that I created for review. There are five central tendency centers, five box plots centers, and five mean absolute deviation centers. Each card has several questions that require calculations and analyzing information. I printed them out on card stock paper and made cards out of them with the answers on the back of each card. This is a great way to review these concepts.
Subjects:
Grades:
4th - 8th
Types:
CCSS:
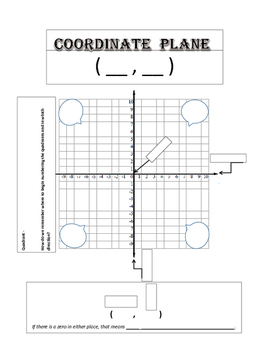
Coordinate Plane Graphic Organizer
This is a graphic organizer that I made for my students' interactive notebook. The students label each part of the coordinate plane and have visual clues to help them. This is a great review before moving on to graphing points, graphing lines, transformations on the coordinate plane, etc.
Grades:
5th - 12th, Higher Education, Adult Education, Staff
Find the Error - Data and Graphs with Central Tendency and Variation
This is an activity that I created for my students to find the mistake when a student has answered questions from graphs about measures of center and variation incorrectly. I used common errors to help them see the mistakes commonly made. All of my products are common core aligned.I had the students work alone to solve the problems first, and then share with their groups. If there was any discrepancy, they looked in the answer folder on their tables to see the correct answer. I rotated around
Subjects:
Grades:
5th - 7th
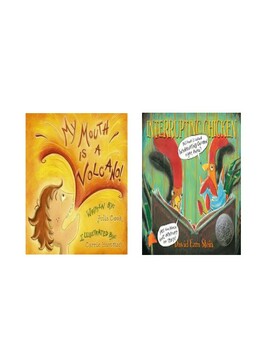
My Mouth Is a Volcano! and Interrupting Chicken Read Aloud (Print and Digital)
Louis, in My Mouth Is a Volcano!, and Little Red Chicken, in Interrupting Chicken, have a hard time keeping their words from erupting like a volcano. I have included:YouTube links for both booksclassroom book cover with student page and sentence starter for both booksMy Mouth Is a Volcano! by Julia Cook14 vocabulary words, focusing on nouns and verbsnoun and verb sortHow to Control Your Volcano Mouth poster4 comprehension questions in 2 formatsbeginning, middle, end retell organizer with answers
Subjects:
Grades:
1st - 3rd
Types:
Also included in: Back to School and End of Year Bundle: 11 Read Alouds
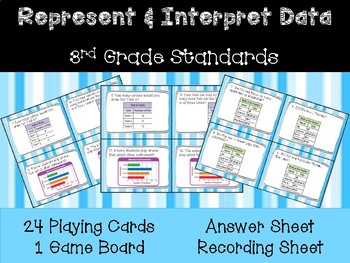
Math Chapter 2- Represent and Interpret Data Game
Represent and Interpret Data is a math game to reinforce math skills taught in third grade.
This game covers the following standards:
CCSS.MATH.CONTENT.3.MD.B.3
Draw a scaled picture graph and a scaled bar graph to represent a data set with several categories. Solve one- and two-step "how many more" and "how many less" problems using information presented in scaled bar graphs. For example, draw a bar graph in which each square in the bar graph might represent 5 pets.
CCSS.MATH.CONTENT.3.MD.
Subjects:
Grades:
2nd - 4th
Types:
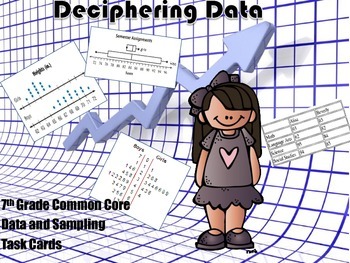
Data and Inferences Task Cards - Common Core Aligned
This is a set of 36 task cards covering 7th grade common core math concepts involving data. In the set, there are computation problems, conceptual problems, and problem solving problems. My students love this alternative way of practicing and discussing math. It leads to some very rich discussions!
If you bought my Deciphering Data Board Game, don't buy this because it has a lot of the same questions.
Subjects:
Grades:
6th - 7th
Types:
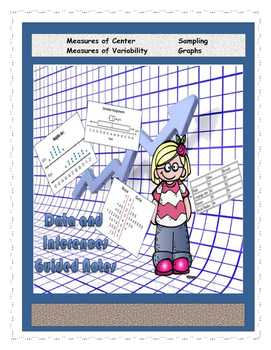
Data, Graphing, and Sampling Interactive Notes
I use this as interactive notes with my students. Included in the notes are vocabulary, examples, dot plots, box plots, histograms, stem and leaf plots, measures of center, measures of variation, population, and sampling.
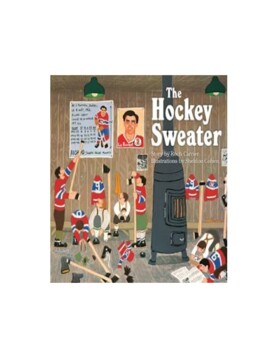
The Hockey Sweater Read Aloud (Print and Digital)
In this classic, written by Roch Carrier, the boy is horrified when the hockey sweater that arrives in the mail, from Eaton's catalogue, is the wrong sweater. What will Roch do to solve his problem? I have included:YouTube links (book and animated version)making predictions template4 comprehension questions in 2 formatsclassroom book cover with 2 students pages and sentence starters (favourite part, If I were Roch . . .)making connections templateretell organizer or cut and paste sentence strips
Subjects:
Grades:
1st - 5th
Also included in: Winter Bundle: Read Alouds
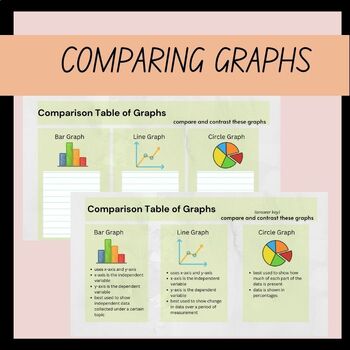
Analyzing Graphs Bar-Line-Circle Easel Graphic Organizer
Work alongside students to analyze and compare three important graphs in maths and science. Students will analyze the value behind each type of graph, how each graph displays the data, and when it is best to use each graph to represent the data.You may also like;Comparing Bar, Line, and Circle Graph WorksheetAnalyzing Bar, Line, Circle Graphs in Graphic OrganizerView our algebra related worksheets:Adding IntegersSubtracting IntegersMultiply IntegersDividing IntergersCombining Like TermsBases and
Subjects:
Grades:
4th - 6th
Types:
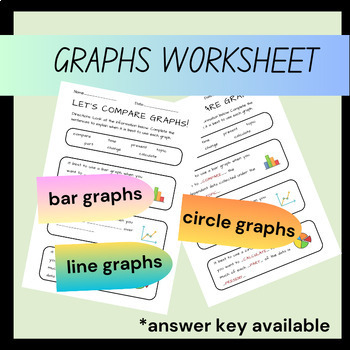
Comparing Bar, Line, and Circle Graphs Easel Worksheet for 5th Grade
Students will work to complete the answers in this fill-in-the-blank worksheet to understand the purpose behind each type of graph, how each graph displays the data, and when it is best to use each graph to represent the data.Other Data and Management ProductsComparing Bar, Line, and Circle Graph WorksheetAnalyzing Bar, Line, Circle Graphs in Graphic OrganizerYou may also like our algebra related worksheets:Adding IntegersSubtracting IntegersMultiply IntegersDividing IntergersCombining Like Ter
Subjects:
Grades:
4th - 6th
Types:
Showing 1-10 of 10 results


