6 results
Graphing Common Core W.5.10 resources
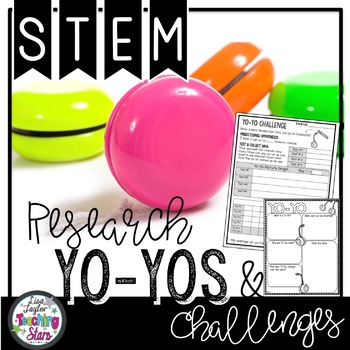
STEM Yo-Yo Challenge and Research
Yo-Yo STEM Activity is a packet of experiements your students will love! Yo-Yoing is a fun activitiy your students will love! It will engage your students in learning about collecting data, graphing, measurement, and Energy. These activities can also be used for STEAM Activities, Maker Spaces, Tinkering Labs, Summer Programs, or After School Clubs. *This activity is included in my STEM Yearlong Bundle. Other Products: STEM Waterbottle ChallengesSTEM Valentine's Day ChallengesSTEM March Challen
Subjects:
Grades:
3rd - 5th
Types:
NGSS:
3-5-ETS1-3
, 3-5-ETS1-1
, 3-5-ETS1-2
Also included in: STEM Challenges Bundle | Holiday STEM Activities
Salt Water vs. Fresh Water Graph and Lesson Plan
What are the benefits of using this resource?This graph and lesson plan will save you time.Use your time away from school to do what you enjoy. Use your planning periods to catch up with your colleagues rather than doing more work.You can use the answers to check what your students colored and labeled on the circle graph. Compare the sample short answer response to what your students wrote.You can use the 6-step lesson plan to walk through this 45-minute lesson with your students.Click “View Pre
Subjects:
Grades:
4th - 6th
Types:
NGSS:
5-ESS2-2
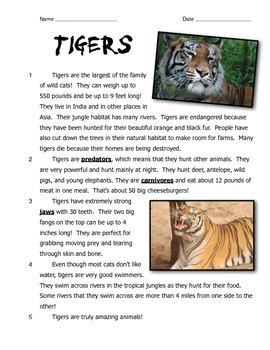
Bengal Tigers: Reading, Writing, and Arithmetic!
Combine reading, writing, and math in an animal study about Bengal Tigers! This four-page activity involves reading a nonfiction passage about tigers and then answering questions. Students are prompted to go back to the text and highlight or underline where they found the answer (or a clue for the answer, in the case of an inference). Students answer questions about vocabulary that was presented in the passage, as well as fill in missing information on a graphic organizer. They also are aske
Subjects:
Grades:
3rd - 5th
Types:
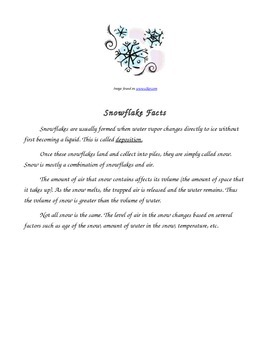
Snow Science! How Dense is Our Snow? A Hands On Science Experiment.
When the snow starts falling, students love to play around in it. Here is a science experiment that ties in their love of snow with learning! This Science Experiment measures the amount of liquid in snow and leads to a discussion on density. I tie this experiment to an introduction to our fractions unit in math. Even in 5th grade students need a reminder that fractions are a part of a whole. They will also get to see a real world example of when fractions, graphs, and line plots are used to help
Subjects:
Grades:
3rd - 8th
Types:
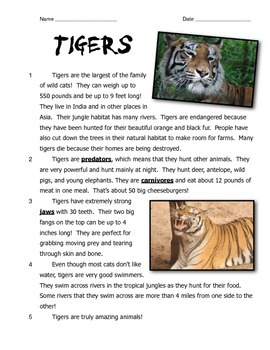
Bengal Tigers: Reading, Writing, and Arithmetic!
Combine reading, writing, and math in an animal study about Bengal Tigers! This four-page activity involves reading a nonfiction passage about tigers and then answering questions. Students are prompted to go back to the text and highlight or underline where they found the answer (or a clue for the answer, in the case of an inference). Students answer questions about vocabulary that was presented in the passage, as well as fill in missing information on a graphic organizer. They also are aske
Subjects:
Grades:
3rd - 5th
Types:
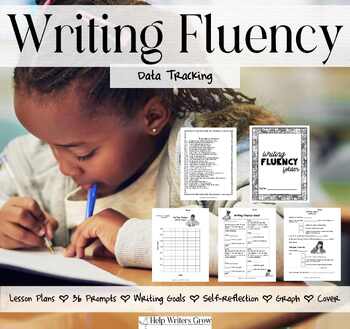
Writing Fluency - Student Data Tracking
Do you want to use data tracking for students for their writing fluency?Do you need another data point for student services?Would you like students to monitor and graph their progress and use this data for student-led conferences?Then, I got you!This year-long writing fluency program gives students a weekly, three-minute writing prompt to write, count, and then record their word count on a graph. Students set their own fluency goals, take the time every quarter to reflect on their progress, and
Subjects:
Grades:
3rd - 5th
Types:
Showing 1-6 of 6 results


