11 results
Algebra 2 Common Core HSS-ID.A.2 resources for Microsoft Word
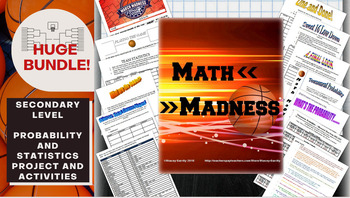
Math March Madness Full Tournament Project {BUNDLE}
Harness the excitement of NCAA March Madness with this huge project for secondary math teachers that follows all stages of the tournament! This Common Core aligned bundle comes with bonus parts not sold individually in my store so you can create a rich immersion in the tournament, practice probability and statistics and learn some interesting new ones along the way! Save $3 plus get bonus content by bundling!You can pick and choose which parts you would like to incorporate, or follow my schedu
Subjects:
Grades:
6th - 12th, Higher Education
Types:
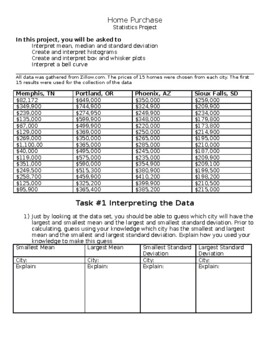
Home Prices: High School Statistics Project
This statistics project has students exploring home prices and using their knowledge of mean, median, standard deviation, histograms, box and whisker plots, and bell curves to make predictions and inferences about the data. This project is provided in a word document to allow the teacher the ability to edit the document or load it to a google doc. In this project students first make predictions about measures of spread and central tendency without calculating but by looking at the data. Students
Subjects:
Grades:
9th - 12th
Types:
CCSS:
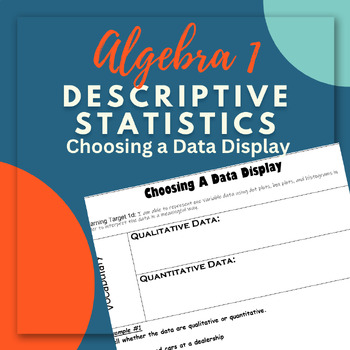
Choosing a Data Display
This is an editable copy of a notes outline for Algebra 1. This outline is designed to be used within the Descriptive Statistics Unit. These notes cover choosing the best way to display your data and misleading graphs that can create bias. Check out my other notes outlines and my student reflection tools that align with the notes for each unit!
Subjects:
Grades:
9th - 12th
CCSS:
Also included in: Descriptive Statistics Notes and Student Reflection Bundle
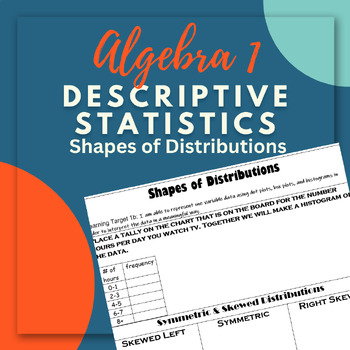
Shapes of Distributions Notes Outline
This is an editable copy of a notes outline for Algebra 1. This outline is designed to be used within the Descriptive Statistics Unit. These notes cover the shapes of distributions of data. Check out my other notes outlines and my student reflection tools that align with the notes for each unit!
Subjects:
Grades:
9th - 12th
Types:
CCSS:
Also included in: Descriptive Statistics Notes and Student Reflection Bundle
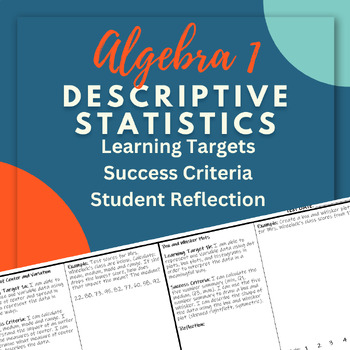
Descriptive Statistics Student Reflections
This is an editable copy of a student reflection sheet for Algebra 1. This reflection page is designed to go with the Descriptive Statistics Unit. The handout has learning targets, success criteria, student self assessment and reflection opportunities. These can be used for ongoing reflection throughout the unit or at the end of the unit as a form of review. Check out my notes outlines that align with these reflections or the unit bundle is available too!
Subjects:
Grades:
9th - 12th
Types:
CCSS:
Also included in: Descriptive Statistics Notes and Student Reflection Bundle
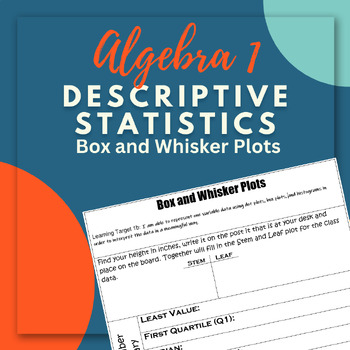
Box and Whisker Plots Notes Outline
This is an editable copy of a notes outline for Algebra 1. This outline is designed to be used within the Descriptive Statistics Unit. These notes cover box and whisker plots. Check out my other notes outlines and my student reflection tools that align with the notes for each unit!
Subjects:
Grades:
9th - 12th
Types:
CCSS:
Also included in: Descriptive Statistics Notes and Student Reflection Bundle
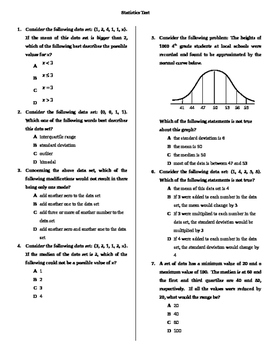
Statistics (Algebra) Test
Twelve multiple-choice, higher-level thinking questions covering topics of outliers, trends, mean, median, variance, range, standard deviation, and various graphical representations of data. Good stuff.
Subjects:
Grades:
9th - 12th
Types:
CCSS:
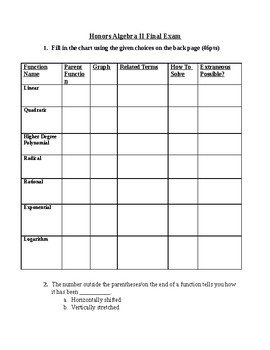
Honors Algebra 2 Final Exam
This is a concept based final exam suitable for average to honors level Algebra 2 curricula. It follows basic common core skill sets and includes probability, number sets, standard distribution, and two-way tables but not trigonometry. I use it as an assessment for the students I home-school and study guide for students in public or private school settings. The first section involves matching graphs, key terms/skills, and parent equations to the various functions introduced in Algebra 2. The voc
Subjects:
Grades:
10th - 12th
CCSS:
Also included in: Algebra 2 Bundle
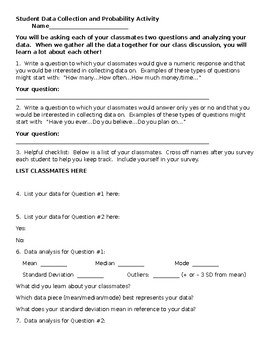
Student Data Collection and Probability Activity
This activity gets students up and talking with each other. Students create a question with a numeric response and one question with a yes/no response and collect data. Results are then analyzed with standard measures and probabilities are calculated using the binomial distribution theorem.
Subjects:
Grades:
9th - 12th
Types:
CCSS:
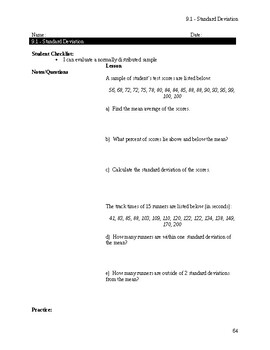
Standard Deviation Notes
We will be introduced to the concept of the variance of a set of data and will use calculators to determine the standard deviation of a set of data. We will also begin placing our data onto a number line that counts by the standard deviation of a set.
Subjects:
Grades:
10th - 12th
Types:
CCSS:
Also included in: Unit 9: Statistics

Area Under the Curve Notes
We will calculate the precise proportion of data under a normally distributed set within a range of values using the graphing calculator. We will express our findings as proportions, percentages, and quantities interchangeably.
Subjects:
Grades:
10th - 12th
Types:
CCSS:
Also included in: Unit 9: Statistics
Showing 1-11 of 11 results


