6 results
7th grade statistics scaffolded note interactive whiteboards
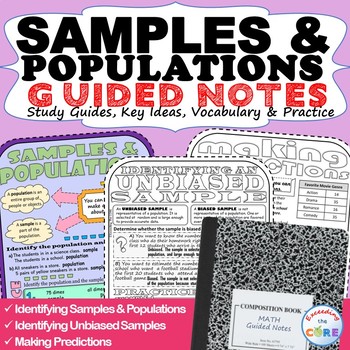
SAMPLES & POPULATIONS Doodle Math - Interactive Notebooks (Guided Notes)
- Great for online learning and distance learning!Have your students use these SAMPLES & POPULATIONS Guided Notes to review key ideas and essential vocabulary . Guided Notes aid in student focus, concept retention, engagement and creativity. Using this resource will allow students to synthesize this math concept and create their own tangible connections in their notes. Guided Notes Includes:__ Key Ideas with Verbal & Numerical Examples__ Essential Vocabulary with Definitions__ Skills Pr
Subjects:
Grades:
6th - 8th
Also included in: 7th GRADE MATH Assessments, Warm-Ups, Task Cards, Worksheets BUNDLE
What is Average? Lesson 2- Introducing mean
This lesson and activity packet contains everything you need to help your students master the strategies to determine the mean of a data set. Through real-world practice, your students will investigate each concept and apply their learning. This activity includes interactive SMARTBoard slides, vocabulary handouts, guided note-sheets, a Socrative exit slip, and class and homework options. This lesson can be used individually, or as a follow up to “What is Average? - Mean, Median and Mode.” D
Subjects:
Grades:
4th - 8th
What is Average? Lesson 1 - Median, Mode, and Range
This lesson and activity packet contains everything you need to help your students master median, mode and range. Through real-world practice, your students will investigate each concept and apply their learning. This activity includes interactive SMARTBoard slides, vocabulary handouts, guided note-takers, and class and homework options. Dive in to this fun investigation of important math concepts.
Be sure to check out my other great lessons and worksheets and let me know what you t
Subjects:
Grades:
4th - 8th

Using Models to Represent Ratios and Rates! SmartBoard Lesson / Scaffold Notes
In this SmartBoard lesson, students will learn how number lines, charts, tables and graphs can be used to represent unit rates, rates and ratios. Students will be given examples of how ratios are placed in tables/charts to see relationships and solve for unknowns. Students will see how double number lines are also used to represent rates and ratios. Lastly, students will see how line graphs, using x and y along with points can represent ratios and rates. There are examples of each for the class
Subjects:
Grades:
5th - 7th

Always, Sometimes, Never Sets Smart Notebook
This is a SmartNotebook document for notes on Always, Sometimes, Never Sets. It is editable.
Subjects:
Grades:
7th - 11th

Mean Absolute Deviation Lesson
This is a smartboard lesson on how to calculate the mean absolute deviation. The lesson is currently filled in, which you can erase, and has examples as well as bell work.
Subjects:
Grades:
6th - 9th
Showing 1-6 of 6 results


