136 results
Statistics independent works on sale
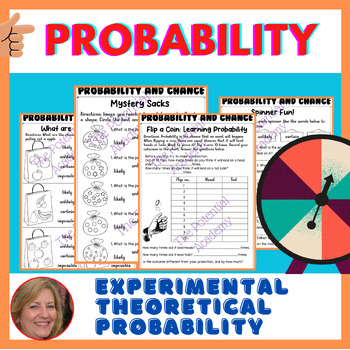
Chance and Probability, Theoretical & Experimental Probability Activities
Do your children have trouble determining the likelihood of events and situations? Then this Probability and Chance package is for you! This set is packed with full worksheets and activities to teach your children all about Probability & Chance.There is a set of questions about Probability and Chance for a student to get to know the concept of Probability through the language of change: likely, unlikely, certain, impossible, more likely, less likely, and equally likely, certain, likely, unli
Subjects:
Grades:
5th - 7th
Types:
Also included in: (BUNDLE) Chance and Probability worksheets & Area and Perimeter 3rd math
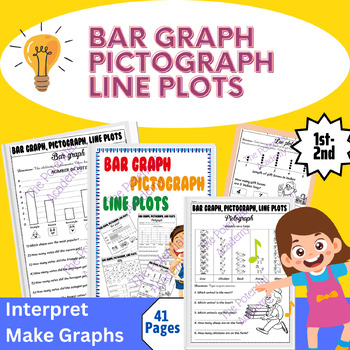
Bar Graphs, Pictographs, Line Plots, Tally Graph worksheet - Types of graph
Are you looking for a mix of no-prep activities for bar graphs, pictographs, and line plots? This Bar Graph, Pictograph, Tally, and Line Plots pack includes a variety of exercises for practicing reading graphs, showing data, and analyzing data on bar graphs, pictographs, and line plots in no time!The two main activities, reading graphs and drawing graphs, were designed with different practices to enhance their understanding of working with bar graphs, pictographs, tally, and line plots. There ar
Subjects:
Grades:
1st - 2nd
Types:
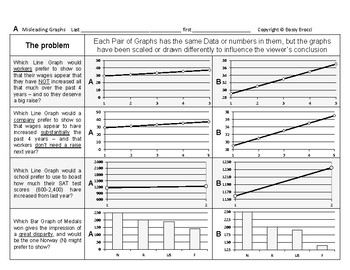
Stats&Data 14: Misleading & Misinterpreting Data Graphs Charts Statistics
This is an excerpt from my popular line ofBossy Brocci Math & Big Science workbooks on Amazon.ANSWER KEY included=======================Students will:1) Analyze 20 different Graphs or Data Displays2) Draw Conclusions & Answer questions about theaccuracy, fairness, limitations & legitimacy of those Graphs3) Answer 16 Multiple-choice questionsbased on their Calculations & Observations4) Be compelled to show their work in a neat & orderly format5) Be trained to methodically &
Subjects:
Grades:
Not Grade Specific
Types:
Stats&Data Bundle C: Data Displays Measures of Central Tendency & Variation
From the Author of Bossy BrocciMath & Big Science workbooks on Amazon,this Bundle of Data Displays,Measures of Central Tendency(Mean, Median, Mode & Range);and Measures of Variation(Quartiles, Interquartile Range, Outliers & Box Whisker plots)contains:11 Lessons32 Worksheets832 Problems & Tasks- and Assessment up the a$$=======================Answer KEYS included=======================Coverage Specifics:#1 Identify & Select Common Typesof Data DisplaysStudents will:1) Identi
Subjects:
Grades:
Not Grade Specific
Types:
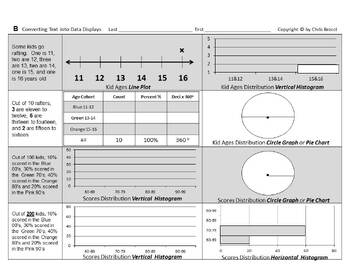
Stats&Data Slides Bundle C: Data Displays Measures of Central Tendency Variation
From the Author of Bossy BrocciMath & Big Science workbooks on Amazon,comes student fillable editable interactiveGoogle Slides™ for Google Classroom™ Students can insert/overlay text & graphics[textboxes, shapes, lines, arrows, colors etc.]onto the G-Slide image backgroundorConvert to PDF, then make it interactive onlineby using various third-party Ed. websitesorPrint it for paper worksheets=======================This Bundle of Data Displays,Measures of Central Tendency(Mean, Median, M
Subjects:
Grades:
Not Grade Specific
Types:
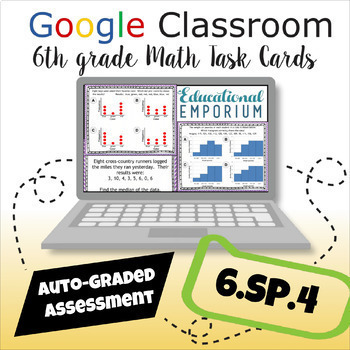
6.SP.4 Math Task Cards SELF-GRADING 6th Grade ★ Displaying Numerical Data
Plotting Data on Number Lines, Including Dot Plots, Histograms, and Box Plots Task Cards for 6th Grade Math Centers: These 12 digital task cards (2 sets of 6) are aligned with Common Core Standards 6.SP.4: Displaying Numerical Data in Plots on a Number Line, Including Dot Plots, Histograms, and Box Plots. Designed to make the classroom efficient and interactive, these task cards are presented as a self-grading Google Form that automatically generates a spreadsheet of student scores, making gradi
Grades:
5th - 7th
Types:
CCSS:
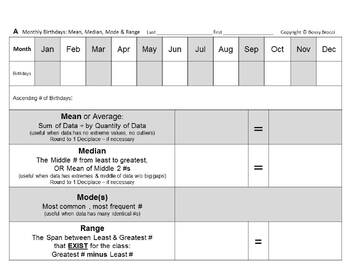
Stats&Data Slides Bundle B: Birthdays Data Displays Variation Mean Median Mode
From the Author of Bossy BrocciMath & Big Science workbooks on Amazon,comes student fillable editable interactiveGoogle Slides™ for Google Classroom™ Students can insert/overlay text & graphics[textboxes, shapes, lines, arrows, colors etc.]onto the G-Slide image backgroundorConvert to PDF, then make it interactive onlineby using various third-party Ed. websitesorPrint it for paper worksheets=======================This Birthdays Stats (Mean, Median, Mode, Range),Measures of Variation &am
Subjects:
Grades:
Not Grade Specific
Types:
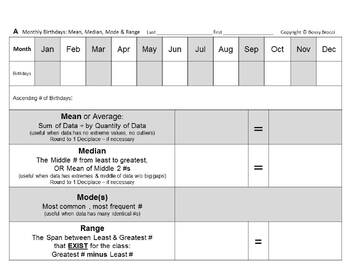
Stats&Data Bundle B: Birthdays Data Displays Variation Mean Median Mode Range
From the Author of Bossy BrocciMath & Big Science workbooks on Amazon,this Birthdays Stats (Mean, Median, Mode, Range),Measures of Variation & Data Displays Bundlecontains:2 Lessons12 Worksheets294 Problems & Tasks- and Assessment up the a$$=======================Answer KEY included=======================Coverage Specifics:#1 Author's Numbers Birthdays ProjectStudents will:1) Convert the given Monthly Birthdaysfrom Mr. Brocci's School numbers into:Ascending List/Data SetMeanMedianMod
Subjects:
Grades:
Not Grade Specific
Types:
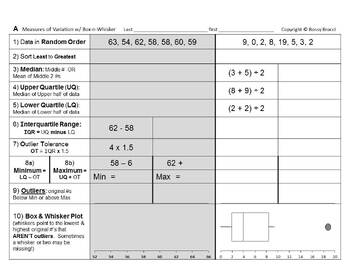
Stats&Data Slides Bundle A: Measures of Variation Box & Whisker Box Plots
From the Author of Bossy BrocciMath & Big Science workbooks on Amazon,comes student fillable editable interactiveGoogle Slides™ for Google Classroom™ Students can insert/overlay text & graphics[textboxes, shapes, lines, arrows, colors etc.]onto the G-Slide image backgroundorConvert to PDF, then make it interactive onlineby using various third-party Ed. websitesorPrint it for paper worksheets=======================This Measures of Variation Box & WhiskerBox Plots Bundlecontains:4 Les
Subjects:
Grades:
Not Grade Specific
Types:
Análisis de datos y Probabilidad: Pictogramas y Tablas de frecuencias Gr. 3-5
Obtén una mayor comprensión sobe los pictogramas y las tablas de frecuencia con este atractivo recurso. Los conceptos incluyen: pictogramas, suma, tablas de frecuencia, resta. Este recurso, redactado para los estudiantes de tercer a quinto grado, se divide en tres secciones: Hojas de tarea con problemas de texto, seguido por Hojas de simulacro para practicar la competencia de los estudiantes en las habilidades procesales, y finalmente una prueba de evaluación. La clave de respuestas está incluid
Subjects:
Grades:
3rd - 5th
Types:
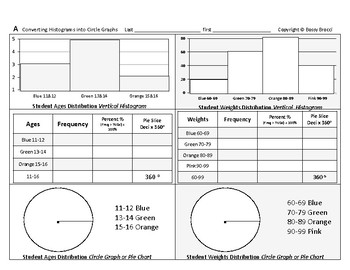
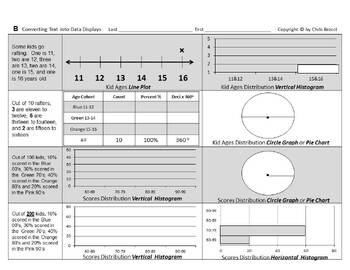
Stats&Data 03: Convert Histograms into Circle Graphs Construct Create Pie Charts
This is an excerpt from my popular line ofBossy Brocci Math & Big Science workbooks on Amazon.Answer KEY included=======================Students will:1) Convert 3 Vertical Histograms into3 Data Tablesand3 Colored or Shaded Circle Graphs (Pie Charts)2) Convert 1 Horizontal Histogram into1 Data Tableand1 Colored or Shaded Circle Graph (Pie Chart)3) Be compelled to show their work in a neat & orderly format4) Be trained to methodically & systematicallyPresent Data in different DisplaysN
Subjects:
Grades:
Not Grade Specific
Types:
6.SP.1 Task Cards 6th Grade Math AUTO-GRADED Google Form ★ Statistical Questions
Asking Statistical Questions Task Cards for 6th Grade Math Centers: These 12 digital task cards (2 sets of 6) are aligned with Common Core Standard 6.SP.1: Recognize a Statistical Question as One that Anticipates Variability in the Data Related to the Question and Accounts for it in the Answers. Designed to make the classroom efficient and interactive, these task cards are presented as a self-grading Google Form that automatically generates a spreadsheet of student scores, making grading papers
Grades:
5th - 7th
Types:
CCSS:
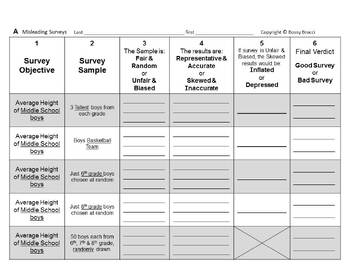
Stats&Data Bundle D: Misleading Misinterpreting Surveys Statistics Graphs Charts
From the Author of Bossy BrocciMath & Big Science workbooks on Amazon,this Bundle onMisleading & MisinterpretingSurveys, Statistics, and Graphs/Chartscontains:2 Lessons8 Worksheets78 Problems & Tasks- and Assessment up the a$$=======================Answer KEYS included=======================Coverage Specifics:#1 Misleading & Misinterpreting Surveys & Statistics+ QUIZStudents will:1) Read 10 different Surveys and Survey Samples2) Determine and Write if those Surveys are:Fair
Subjects:
Grades:
Not Grade Specific
Types:
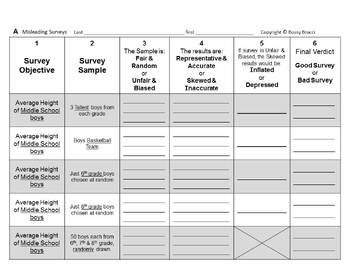
Stats&Data Slides Bundle D: Misleading Misinterpreting Surveys Statistics Graphs
From the Author of Bossy BrocciMath & Big Science workbooks on Amazon,comes student fillable editable interactiveGoogle Slides™ for Google Classroom™ Students can insert/overlay text & graphics[textboxes, shapes, lines, arrows, colors etc.]onto the G-Slide image backgroundorConvert to PDF, then make it interactive onlineby using various third-party Ed. websitesorPrint it for paper worksheets=======================This Bundle onMisleading & MisinterpretingSurveys, Statistics, and Gr
Subjects:
Grades:
Not Grade Specific
Types:
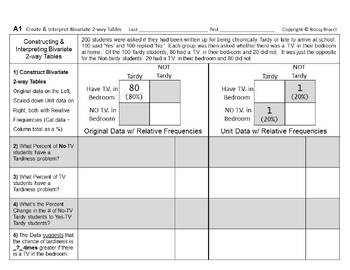
Stats&Data Slides 12: Construct Analyze Bivariate Two-way Frequency Data Tables
From the Author of Bossy BrocciMath & Big Science workbooks on Amazon,comes student fillable editable interactiveGoogle Slides™ for Google Classroom™ Students can insert/overlay text & graphics[textboxes, shapes, lines, arrows, colors etc.]onto the G-Slide image backgroundorConvert to PDF, then make it interactive onlineby using various third-party Ed. websitesorPrint it for paper worksheetsANSWER KEY included=======================Students will:1) Construct a Pair of Raw and Unit/Simpl
Subjects:
Grades:
Not Grade Specific
Types:
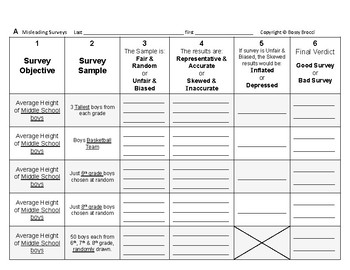
Stats&Data 13: Misleading & Misinterpreting Surveys & Statistics + QUIZ
This is an excerpt from my popular line ofBossy Brocci Math & Big Science workbooks on Amazon.ANSWER KEY included=======================Students will:1) Read 10 different Surveys and Survey Samples2) Determine and Write if those Surveys are:Fair & RandomUnfair & BiasedRepresentative & AccurateSkewed & InaccurateInflatedDepressedGood SurveyBad Survey3) Answer 24 Multiple-choice questionsbased on their Observations4) Analyze 5 Statistical Problems & Conclusions for accuracy
Subjects:
Grades:
Not Grade Specific
Types:
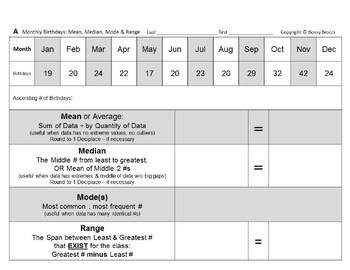
Stats&Data Slides 10: Author Birthdays Variation Central Tendency Data Displays
From the Author of Bossy BrocciMath & Big Science workbooks on Amazon,comes student fillable editable interactiveGoogle Slides™ for Google Classroom™ Students can insert/overlay text & graphics[textboxes, shapes, lines, arrows, colors etc.]onto the G-Slide image backgroundorConvert to PDF, then make it interactive onlineby using various third-party Ed. websitesorPrint it for paper worksheetsAnswer KEY included=======================Students will:1) Convert the given Monthly Birthdaysfro
Subjects:
Grades:
Not Grade Specific
Types:
Data Analysis Statistics and Probability worksheets (63 Problems) (SAT Review)
Data analysis statistics and probability worksheets ,63 problemsSAT ReviewFraction and Data (29 Multiple choice questions)Statistic Problem (15 questions)Probability Word Problems This section contains 19 word problems about :Simple ProbabilityCounting PrincipleIndependent ProbabilityDependent ProbabilityMutually Exclusive EventsPermutationsCombinationsConditional Probability* AlSO AVAILABLE FOR YOU OR A COLLEAGUE! - CLICK ANY LINK YOU WANT:Number and Operations (SAT Review) Algebra & Functi
Subjects:
Grades:
7th - 12th, Higher Education, Adult Education, Staff
Types:
Probability of Simple Events Math Color by Number
This fun math coloring page is all about finding the probability of simple events! Students can work on finding the probabilities of the events and use the code to color in the picture. Math color sheets are perfect for keeping early finishers engaged, as well as for review and homework.What's Included:✓ 1 sheet of problems (10 probability of simple events problems)✓ 1 color page✓ answer keyThis resource is great for:✧ Math Centers, Math Stations✧ At Home Learning, Homework✧ Skill Practice or Re
Subjects:
Grades:
6th - 7th
CCSS:
Stats&Data Slides 11: YOUR Birthdays Variation Central Tendency Data Displays
From the Author of Bossy BrocciMath & Big Science workbooks on Amazon,comes student fillable editable interactiveGoogle Slides™ for Google Classroom™ Students can insert/overlay text & graphics[textboxes, shapes, lines, arrows, colors etc.]onto the G-Slide image backgroundorConvert to PDF, then make it interactive onlineby using various third-party Ed. websitesorPrint it for paper worksheets=======================Students will:1) Convert a Monthly Birthdays tallyfrom YOUR School or Clas
Subjects:
Grades:
Not Grade Specific
Types:
Análisis de datos y Probabilidad: Media, Mediana y Moda Gr. 6-8
Obtén una mayor comprensión sobre Media, Mediana y Moda con este atractivo recurso. Los conceptos incluyen: media, mediana, gama, moda, diagramas de caja y bigotes, cuartil inferior, diagrama de líneas, gráficas de líneas. Este recurso, diseñado para los grados de sexto a octavo, se divide en tres secciones: Hojas de tarea con problemas de texto, seguido por Hojas de simulacro para practicar la competencia de los estudiantes en las habilidades procesales, y finalmente una prueba de evaluación. L
Subjects:
Grades:
6th - 8th
Types:
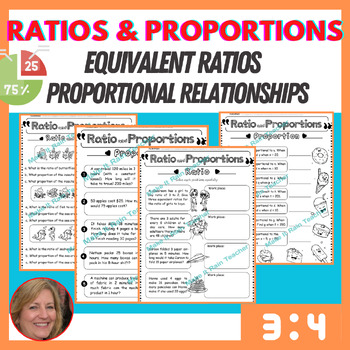
(BUNDLE) Ratios and Proportions & Chance and Probability worksheets
**Ratios and Proportions Activity | Equivalent Ratios | Proportional Relationship**Ratio and proportion are always difficult concepts for students! Make teaching and learning easy with these Ratio and Proportion worksheets. With 40 pages of practical activities, students can improve their understanding of ratios and proportions while developing problem-solving skills. The engaging layout and pictures add fun to the learning process.The activities are differentiated to ensure that students grasp
Subjects:
Grades:
5th - 7th
Types:
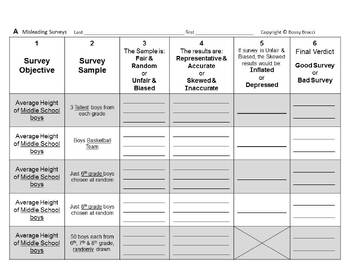
Stats&Data Slides 13: Misleading & Misinterpreting Surveys & Statistics + QUIZ
From the Author of Bossy BrocciMath & Big Science workbooks on Amazon,comes student fillable editable interactiveGoogle Slides™ for Google Classroom™ Students can insert/overlay text & graphics[textboxes, shapes, lines, arrows, colors etc.]onto the G-Slide image backgroundorConvert to PDF, then make it interactive onlineby using various third-party Ed. websitesorPrint it for paper worksheetsANSWER KEY included=======================Students will:1) Read 10 different Surveys and Survey S
Subjects:
Grades:
Not Grade Specific
Types:
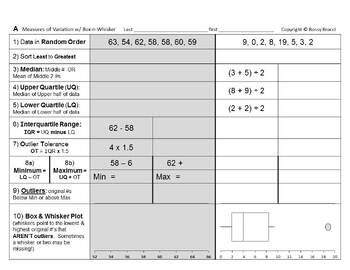
Stats&Data Slides 06: Quartiles Interquartile Range Outliers Box Whisker Plots
From the Author of Bossy BrocciMath & Big Science workbooks on Amazon,comes student fillable editable interactiveGoogle Slides™ for Google Classroom™ Students can insert/overlay text & graphics[textboxes, shapes, lines, arrows, colors etc.]onto the G-Slide image backgroundorConvert to PDF, then make it interactive onlineby using various third-party Ed. websitesorPrint it for paper worksheetsAnswer KEY included=======================Students will:1) Sort or Sequence 8 different Data Sets
Subjects:
Grades:
Not Grade Specific
Types:
Showing 1-24 of 136 results


