53 results
Elementary graphing homework for Easel
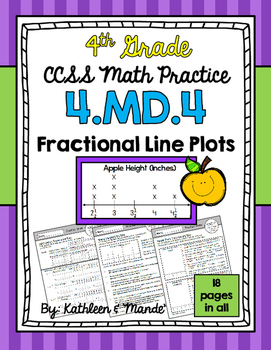
4.MD.4 Practice Sheets: Fractional Line Plots
This 4.MD.4 CCSS aligned packet includes 18 practice sheets to teach/reinforce line plots with whole numbers, fractions, and mixed numbers. These sheets can be used to introduce a concept, review a concept, or send home as reinforcement for homework. **An answer key is provided.- - - - - - - - - - - - - - - - - - - - - - - - - - - - - - - - - - - - - - - - - - - - - - - - - - - - - - - - - - - - - - - - - - -This resource can be used along with our other 4.MD.4 resources:4.MD.4 Task Cards: Set 1
Subjects:
Grades:
3rd - 5th
Types:
Also included in: 4.MD.4 BUNDLE: Fractional Line Plots
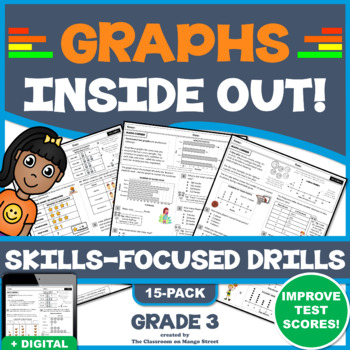
3RD GRADE GRAPHS: BAR, PICTURE, & LINE PLOTS - 15 Skills-Boosting Worksheets
Students will complete word problems related to bar graphs, pictographs, line/dot plots and tally charts. This includes reading and interpreting data, performing calculations, matching data to and representing data in graphs. Use these scaffolded math drills to teach and reinforce the fundamentals, or prep for test day. Each drill begins with a mini-lesson followed by several Common Core designed, simulated test questions (including multi-part & open response). These practice worksheets
Subjects:
Grades:
3rd - 4th
Types:
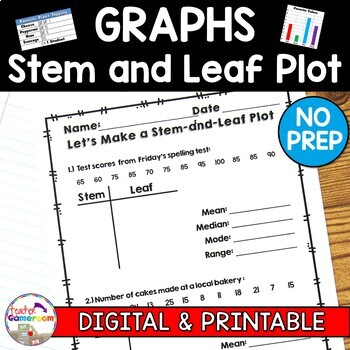
Making a Stem and Leaf Plot with Mean, Mode, Median, Range Worksheets
These worksheets allows students to make a stem and leaf plot using a given set of data. Student must build the plots on their own and then must find the mean, median, mode, and range of the data. There are 4 worksheets, each with 2 Stem and Leaf graphs to be made. Great for review or as a homework assignment. Full Page answer keys included. Extra licenses are $0.75.Questions/Materials include:✔️ 2 Questions per page✔️ 4 Worksheets✔️ 10 - 12 Numbers per graph✔️ 2-Digit and 3-Digit Numbers✔️ Rea
Grades:
4th - 8th
Types:
CCSS:
Also included in: Graphs Bundle | No Prep Digital Resources
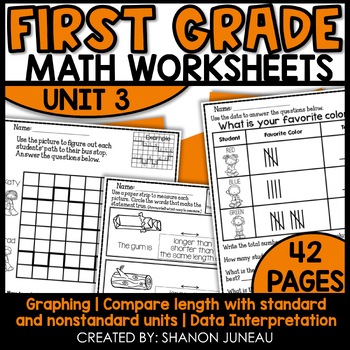
Interpreting Data and Graphing Math Worksheets Bar, Picture Graphs, Tally Charts
These Graphing & Measuring 1st Grade Math Worksheets will help you with graphing, measuring, and working with a simple grid to determine path. These first grade work sheets are perfect for guided instruction, independent instruction, skill reinforcement, and homework. BUNDLED FOR CONVENIENCEYear-long 1st Grade Math Worksheets Save 25%These worksheets cover:measurement (shorter, longer) (shortest, longest)measurement with centimeter cubesgraphing with numbers and tally markscounting pathsbl
Grades:
1st
Types:
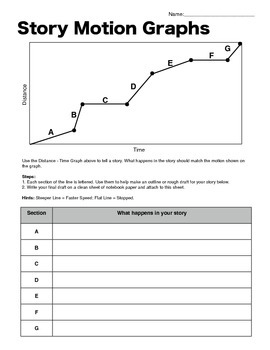
Story Motion Graphs - Distance-Time Graph Writing Activity
This writing activity will allow you to see how well students can interpret a distance-time graph, and let them use their imaginations as well.
Each section of the graph is labeled with a letter. In the table below, students can create an outline for their story that matches the motion graphed above. Then, they can write their final draft on a clean sheet. Even better: there is an advanced version for your higher-level thinkers. They must label the axis with units that match their story.
The
Grades:
5th - 8th
Types:
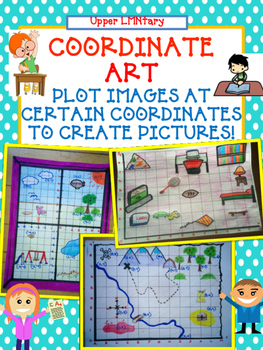
Coordinate Grid Number Line Art Activity - Distance Learning
Coordinate Grid Number Line Art Activity Students will design a scene by creating a coordinate grid/number line. Then students will draw pictures at specified coordinates to create a scene. Included:3 Student Assignment sheets (bedroom, treasure map, and window scenes)2 grid templatesCoordinate Art RubricTons of photos of samplesLet your students be creative and apply what they have learned about coordinates by creating CUTE Art! Use as a group project, home project, assessment or classwork.
Subjects:
Grades:
5th
Types:
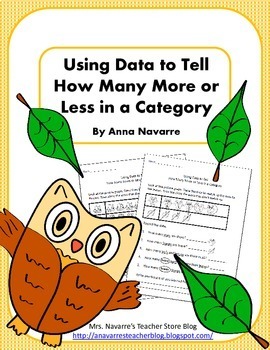
Using Data to Tell How Many More or Less
This Using Data to Tell How Many More or Less in a Category is a great beginning picture graph resource. Students compare numbers (pictures) by drawing lines in order to determine the difference between the two sets. Students then use the picture graph to answer questions about the graph and determine which category has more and which has fewer. Includes:This set includes 10 easy to use practice pages. Be sure to check out the preview to see more. Easel Activities - There are two versions of thi
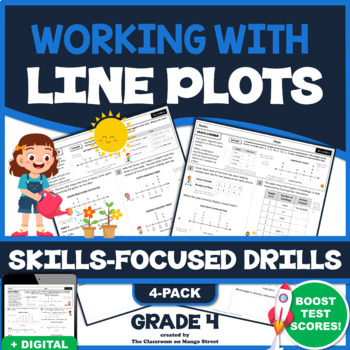
LINE PLOTS: 4 Skills-Boosting Math Worksheets | Grade 4 (4.MD.4)
NEW. Students will read and interpret data shown in line plots. They will also display and match data sets to line plots. Finally, students will solve word problems involving the addition and subtraction of fractions by using information presented in line plots. (4.MD.4). Use these guided math drills to teach and reinforce the fundamentals, or prep for test day. At the top of each worksheet is a mini-lesson followed by several Common Core designed, simulated test questions (including open
Subjects:
Grades:
4th - 5th
Types:
CCSS:
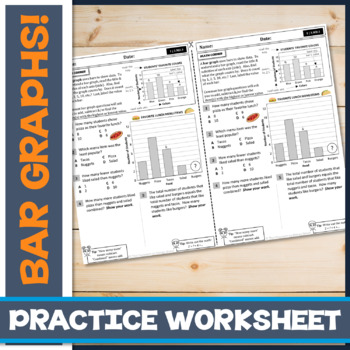
Interpreting Bar Graphs to Solve Word Problems: Exit Slip/Ticket
This is a quick, scaffolded drill on interpreting bar graph data to solve single and multi-step math problems. Use as guided and independent practice, or assign as homework/an exit slip to assess student mastery. This drill has a mini-lesson at the top, followed by 5 questions and originally comes from a larger unit designed to teach third graders Graphs Inside Out!This drill is a half-page, with two of the same activities fitted per page to save on printing. BOOST YOUR MATH TOOLKIT! Bar G
Subjects:
Grades:
3rd - 4th
Types:
CCSS:
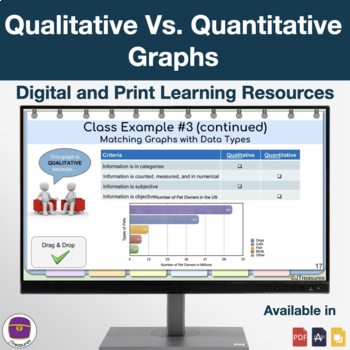
Quantitative vs Qualitative Graphs (Data Management) | Easel, Google Slide & PDF
What are quantitative and qualitative data sets and why does it matter?! This must-have product explores its difference as well as knowing why! Through multiple class examples, students are confidently guided towards learning the difference. They'll be able to classify it by the survey question and by observing the data in different graphs! This purchase comes in three formats: PDF, Easel and Google Slides. Easel and Google Slides are compatible with Google Classroom. To access the Easel pl
Grades:
4th - 6th
Types:
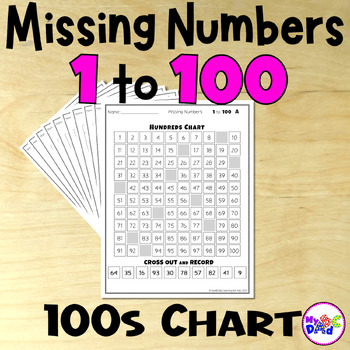
100s Chart Missing Numbers 1 to 100 Math Activities - No Prep
Students will love learning numbers 1 to 100 with a set of ten highly engaging, no prep, print and go missing numbers activities. These activities are a creative way to practice number skills from 1 to 100 on a hundreds chart and can be completed independently. Activities are self-checking with hundreds charts and number clues all on one page. Help inspire number knowledge this year with these fun math activities.What’s included:➯ PDF includes 10 worksheets (2 versions, one with supportive numbe
Grades:
K - 1st
Types:
CCSS:
Also included in: 100s Chart Missing Numbers 1 to 100 and 1 to 1000 Math Activities BUNDLE
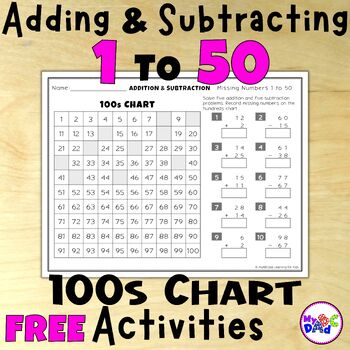
FREE 100s Chart Adding and Subtracting Numbers 1 to 50 Math Activities
Students will love practicing adding and subtracting numbers to 50 with three highly engaging no prep, print and go hundreds chart activities. These addition and subtraction activities are a creative way to support addition and subtraction problem solving and can be completed independently. Activities are self-checking with hundreds charts and problems all on one page. Help inspire addition and subtraction practice this year with these fun math activities.Three activities present ten problems to
Subjects:
Grades:
1st - 2nd
Types:
CCSS:
2nd Grade Chapter 7 Homework Math in Focus 2020
PLEASE NOTE! This is for the 2020 copyright version of the Math In Focus curriculum. If you are looking for the 2015/2018 version, please visit the other categories in my store.It's finally here! Homework for every lesson of Chapter 7 of Math in Focus 2nd Grade 2020 edition.Each page contains 6-10 current concept problems (along with tips and reminders when applicable) and 3-4 review problems from previous concepts. This is the perfect amount of homework for younger grades and the review portion
Subjects:
Grades:
1st - 3rd
Also included in: 2nd Grade Math In Focus 2020 Homework BUNDLE
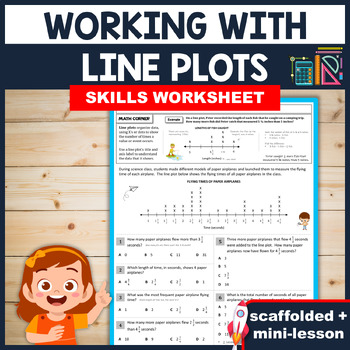
INTERPRETING LINE PLOTS TO SOLVE WORD PROBLEMS: Practice Worksheet (4.MD.4)
This math worksheet requires students to interpret data on a line plot, plus one question requiring students to calculate fractions (in halves and fourths). The worksheet can be used in targeted, small group tutoring sessions or during whole class instruction. You can also assign it as homework review, or as an exit ticket to assess which students mastered the concept. This one-page handout begins with a mini-lesson on reading line plots at the top, followed by 6 math questions. It contains
Subjects:
Grades:
4th - 5th
Types:

Stem and Leaf Plot--Notepages and Practice Sheets
Stem and Leaf Plot--Notepages and Practice Sheets
Best Seller!
In this interactive notebook page/activity, students survey each other to find out their classmate's favorite two digit numbers. They then create a stem and leaf plot based on the data. Practice page of stem and leaf concepts also included.
This activity also helps to review mean, median, mode, and range.
*************************************************************************
Check Out My Other Math Resources
Box and Whis
Subjects:
Grades:
3rd - 8th
Types:
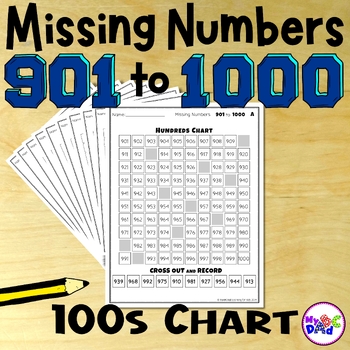
100s Chart Missing Numbers 901 to 1000 Math Activities - No Prep
Students will love learning numbers 901 to 1000 with a set of ten highly engaging, no prep, print and go missing numbers activities. These activities are a creative way to practice number skills from 901 to 1000 on a hundreds chart and can be completed independently. Activities are self-checking with hundreds charts and number clues all on one page. Help inspire number knowledge this year with these fun math activities.What’s included:➯ PDF includes 10 worksheets (2 versions, one with supportive
Grades:
1st
Types:
Also included in: 100s Chart Missing Numbers 1 to 100 and 1 to 1000 Math Activities BUNDLE
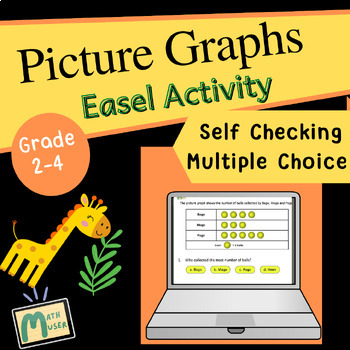
Picture graph worksheets with multiple choice problems - Easel Activity
Your students will love this Easel activity for a complete practice of scaled picture graphs. There are 12 unique picture graphs with 4 multiple choice word problems each. The picture graphs have scale factors of 2, 3 and 4. The word problems are focused on interpreting data and include questions like “how many more”, “which is the highest”, “total number of..”. The visuals are appealing and will keep the students engaged.Please Note:This is an Easel Only resource. If you are interested in the p
Subjects:
Grades:
2nd - 4th
Types:
CCSS:
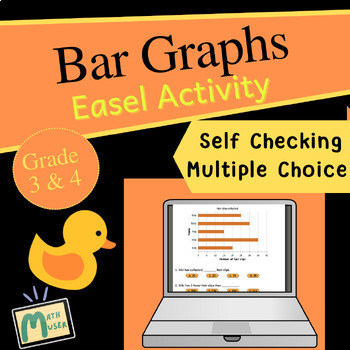
Bar graph worksheets with scaled intervals - Easel Activity
Your students will love this Easel activity for a complete practice of scaled bar graphs. The bars are scaled with the height of bars going up in intervals of 2s, 5s, 10s. Both vertical and horizontal bar graphs are included. There are 18 unique bar graphs with 4 multiple choice word problems each. The word problems are focused on interpreting data and include questions like “how many more”, “which is the highest”, “total number of..”. The visuals are appealing and will keep the students engaged
Subjects:
Grades:
3rd - 4th
Types:
CCSS:
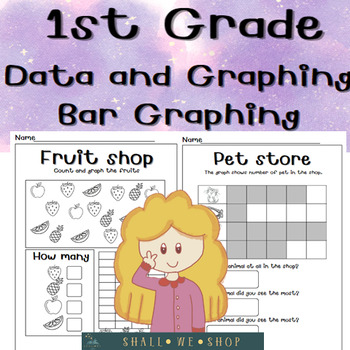
Data and Graphing l Bar graphing l 1st grade
Engage your 1st grade students in the exciting world of graphing with this comprehensive worksheet pack. This resource is designed to help students develop essential skills in counting, tallying, and interpreting data using bar graphs and picture graphs. With a variety of interactive and hands-on activities, your students will have a blast while mastering graphing concepts.Count and Color Graph: Students will count objects and color in the corresponding bar on the graph.Make a Tally: Students wi
Grades:
1st - 2nd
Types:
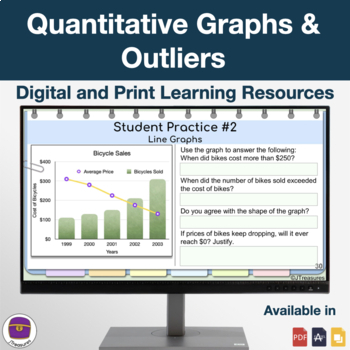
Graphing Quantitative Data & Outliers (Data Management) | Easel, Slide & PDF
Purchase this digital and in-class product that focuses on analyzing and interpreting quantitative graphs. Through stem-and-leaf plots and line graphs, students calculate the mean, median, and mode with different data sets (whole numbers, decimals, and intergers). They also justify whether outliers should be removed or not. This purchase comes in three formats: PDF, Easel and Google Slides. Easel and Google Slides are compatible with Google Classroom. To access the Easel platform, click the "Ope
Grades:
4th - 6th
Types:
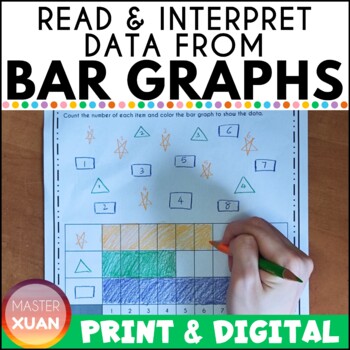
Worksheet On Bar Graphs
Do you need some NO PREP Worksheet On Bar Graphs? This packet includes 26 worksheets to practice reading, interpreting, and drawing horizontal and vertical bar graphs. In addition, there are 4 templates that let you create your own graphs or let your students create questions as part of a pair activity. Students get to color, roll dice, survey, and draw with this packet. Students will have fun and be engaged with these bar graphs printables. So grab it now! ⭐Math Skills (Singapore Primary 3 Syll
Grades:
2nd - 3rd
Types:
CCSS:
Also included in: Practice 3rd Grade Math : Growing Bundle
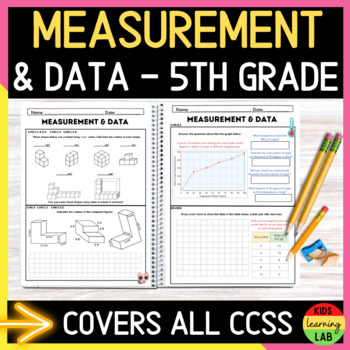
Measurement and Data Unit l Worksheets l Math Test Prep or Homework
These 5th Grade Math Worksheets provide an opportunity to practice ALL 5.MD. Standards - Fifth Grade Measurement and Data Unit of Activities.INCLUDED IN THIS DOWNLOAD13 Pages of Measurement & Data Activities (Including Review & Extension)13 Page Digital Version13 Page Answer Key - Easy for Teachers, Tutors, & Parents3 Pages - Grid Paper⭐PRINT & DIGITAL VERSIONS INCLUDED!⭐✅ Perfect for 5TH GRADE MATH MORNING WORK, MATH HOMEWORK, MATH TEST PREP, or DAILY MATH REVIEW in the classroo
Subjects:
Grades:
3rd - 6th
Insects in the Garden: Graphing Worksheets
Great practice sheets for common core math as it covers the concepts of using a graph to represent data, answering questions about data, and creating a graph using the given data.
Grades:
K - 1st
Types:
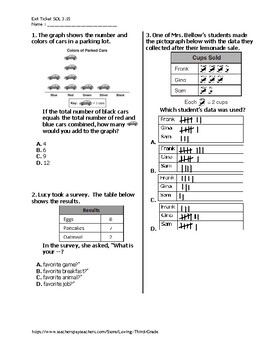
Exit Ticket #2 Math VA SOL 3.15 with TPT Digital Learning Option
This document contains approximately 10 questions related to the Virginia Standards of Learning 3.15 (use data to construct and answer questions about bar graphs and pictographs). This Exit Ticket is great to use before, during and/or after teaching the standard."TpT Digital Activities gives teachers an easy way to...add interactive elements like text boxes, annotations, and shapes to PDF resources to complete assignments entirely from a device – no need to print.""Right now, you must use Goo
Subjects:
Grades:
2nd - 4th
Types:
Also included in: Exit Ticket Math VA SOLs BUNDLE with TPT Digital Learning Option
Showing 1-24 of 53 results


