9 results
Free graphing graphic organizers for Microsoft PowerPoint
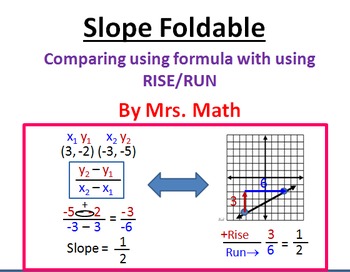
Slope Formula and Rise/Run Foldable
Power Point includes animated step-by-step instructions for creating a foldable for comparing graphing using slope formula and using RISE/RUN to determine the slope from a graphs. Materials needed for each student: scissors, ruler, 2 to 3 markers, 2 printable graphs (provide in power point), glue, and a piece of card-stock or construction paper.
Mathematical foldables (or graphic organizers) are a great way to put important information at students fingertips. They can be used to introduce con
Grades:
7th - 10th
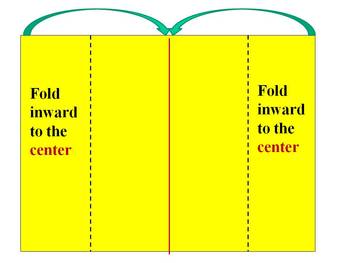
Graphing using standard form and x & y-intercepts Foldable
Power Point includes animated step-by-step instructions for creating a foldable for comparing graphing using "slope-intercept form to graphing using x and y-intercepts. The two graphing concepts that are easily confused by students so this foldable is very helpful. Materials needed for each student: scissors, ruler, 2 to 3 markers, 2 printable graphs (provide in power point), glue, and a piece of card-stock or construction paper.
Mathematical foldables (or graphic organizers) are a great wa
Grades:
7th - 10th
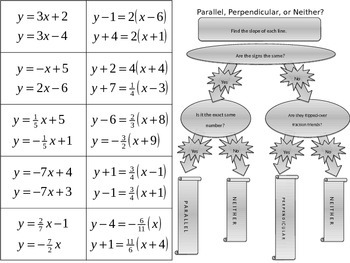
Parallel, Perpendicular, or Neither?
Notebook items for deciding if lines are parallel, perpendicular, or neither. These activities work well for lower-level, at risk, and exceptional learners.
Grades:
7th - 10th
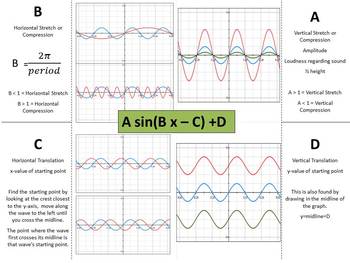
Sin(x) Transformations Foldable with graphs and descriptions
This foldable covers A, B, C, and D from the sine wave equation Asin(Bx-C)+D. It does not cover the debate over calculating phase shifts and stays with a simple model intended for Math Models classes.
Subjects:
Grades:
9th - 12th
Types:

Bar and line graphs
I have a series of powerpoints that I created when going over bar and line graphs. They are very easy to edit and they go over step by step how to create a graph.
Subjects:
Grades:
4th - 6th
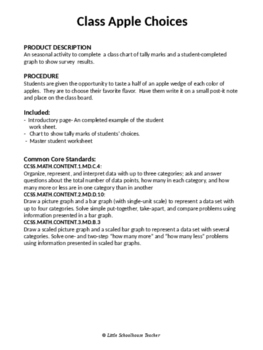
Class Apple Choices Graphs
A seasonal activity to complete a class chart of tally marks and a student-completed graph to show survey results. Students are given the opportunity to taste a half of an apple wedge of each color of apples. They are to choose their favorite flavor. Have them write it on a small post-it note and place on the class board.
Subjects:
Grades:
1st - 4th
Success Tracking Train for Pathways
We make a file folder out of this and and track the kids success in Pathways and Math.
Subjects:
Grades:
PreK - 1st
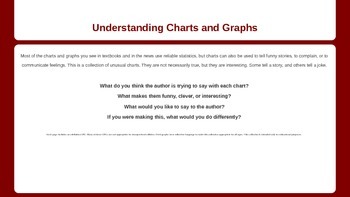
Entertaining Charts and Graphs
This is a collection of a 25 charts and graphs that tell stories or jokes.
This focuses on students' ability to fluently read a Cartesian graph, Venn Diagram, pie chart, etc.
You could integrate this into a lesson plan in a variety of ways. I recommend either:
1. Walking through these slides as a class, then break students into groups to create their own.
2. If you have 25 or fewer students: let each student describe a different slide.
Each slide includes a source attribution URL, and when po
Subjects:
Grades:
6th - 9th
Showing 1-9 of 9 results


