348 results
Presidents' Day graphing graphic organizer microsofts
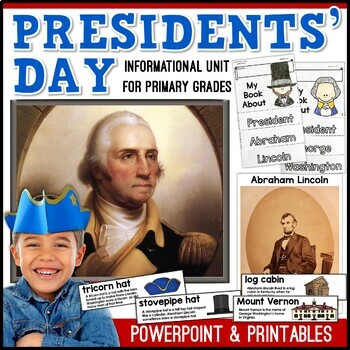
Presidents’ Day Unit with Slideshow – All About Washington and Lincoln
This Presidents’ Day unit is packed full of learning and fun! Complete with an informational PowerPoint about Presidents’ Day, George Washington, and Abraham Lincoln, a tricorn and stovepipe hat project, and lots of printable materials, this set will turn your students into little historians. With eye-catching display materials including headers for several anchor charts along with colorful vocabulary word wall cards, children will have what they need to read, talk, and write about two important
Grades:
K - 1st
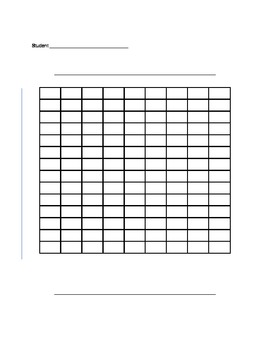
Blank Bar Graph/Double Bar Graph Template
This is a bar graph template that can be used by teachers to teach students how to understand bar graphs and create their own bar graphs. Teachers can use this template teach students about parts of a bar graph and how to interpret data in bar graphs.
Grades:
1st - 12th
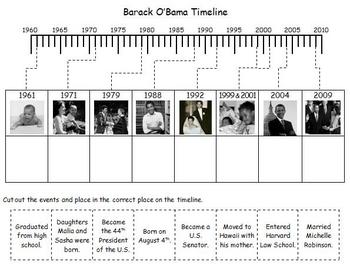
President's Day - Barack Obama Photo Timeline
Students will learn about the important events in Barack Obama's life as they complete this photo timeline. Two versions are included, one for upper elementary and one for lower elementary.
Subjects:
Grades:
1st - 6th
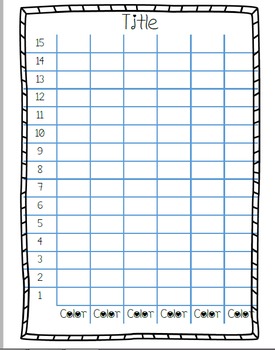
Blank Editable Graphs
These are blank graphs that you can edit by typing in the name of the graph and whatever objects are being graphed. There are bar graphs, a pie graph, and a line graph template.
Subjects:
Grades:
K - 3rd
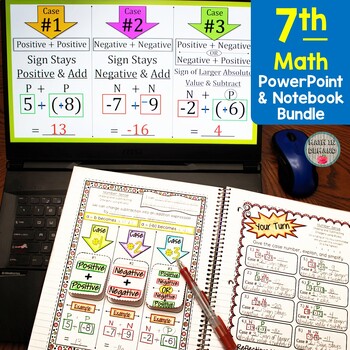
7th Grade Math Notebook & PowerPoint Bundle
This bundle includes my popular 7th Grade Math Interactive Notebook and 7th Grade Math PowerPoints. It includes math concepts for the ENTIRE SCHOOL YEAR! There are 65 PowerPoints that are perfectly aligned to my notebook. All you need to do is open the PowerPoint and click F5. Each PowerPoint includes animations and is editable!The Notebook & PowerPoints include the following math concepts:Unit 1 - Number Sense✅ Absolute Value✅ Rational Numbers on the Number Line✅ Adding and Subtracting Inte
Grades:
7th
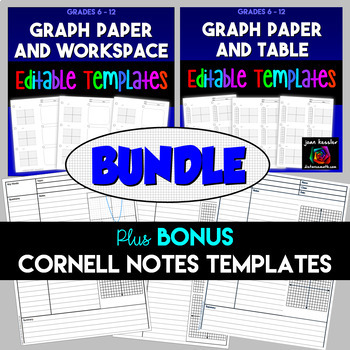
Graph Paper Editable Templates Bundle plus Cornell Notes
I have bundled together two of my very popular time-saving Editable Graphing Templates and added as a bonus two Cornell Notes Templates with Graphs. Use the templates as is, just Print & Go, or add text boxes, graphs, or equations with your favorite editor. The two bundled templates are in both PowerPoint and PDF and the bonus templates are in PowerPoint.___________________________________________________________ You may also like: ★ Foldable Flip Book Editable Double-Sided Template Bundl
Subjects:
Grades:
7th - 10th
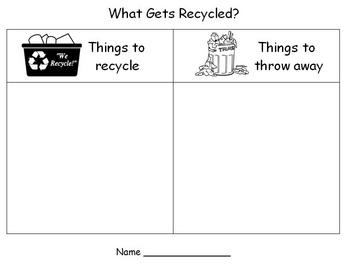
Earth Day - Recycling Sort
Kindergarten and first grade students will increase their knowledge of "Thinking Green" while strenthening their sorting and graphing skills as they complete this "What gets recycled" challenge. A great way to combine math and social studies.
Subjects:
Grades:
PreK - 4th

EXECUTIVE BRANCH: powerpoint & cloze notes sheets
Executive Branch overview. 20 Slide powerpoint and 4 page cloze notes sheet. Teacher notes included with each slide. Great for many grades and ages and all items are editable.You also can purchase THREE BRANCHES OF GOVERNMENT BUNDLE at a discounted price which is this product along with the JUDICIAL BRANCH and the LEGISLATIVE BRANCH
Subjects:
Grades:
5th - 12th
Also included in: THREE BRANCHES OF GOVERNMENT BUNDLE: powerpoints & cloze notes sheets
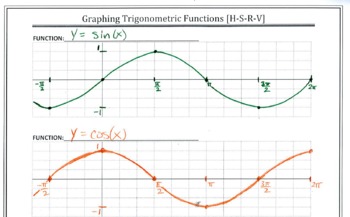
Graph Paper for Trig Functions
This changes everything! Student work becomes more consistent. Your grading will be so much easier! Using the four aligned graphs makes translations of trig functions crystal clear. This file has 2 pages of coordinate planes for graphing trig functions.The first page contains four blank graphs per page. The axes are unlabeled so that students may select their own scale.The second page has five blank graphs per page and is set up for conducting transformations on the coordinate plane.Please see
Subjects:
Grades:
10th - 12th, Higher Education, Adult Education
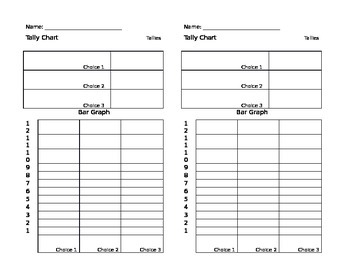
Blank Tally Chart and Graph Paper
This template is designed to let students graph just about anything. Students can start by choosing their own survey question, tallying the results, and making the bar graph.
Documents include 3, 4, and 5 choices for bar graphs. This is a very versatile document to help you with all your graphing needs!
Subjects:
Grades:
1st - 4th

Pattern Blocks with Angle Measures
This is a student resource quick guide displaying angle measures of pattern blocks. An easy resource to print, laminate and share with your students! This supports New York Common Core Mathematics Grade 4: Module 4, Lessons 10 and 11. In these lessons, students use pattern blocks to create angle measures of 90, 180, 270 and 360 degrees. This resource is also great for Math centers!
Subjects:
Grades:
3rd - 6th
CCSS:
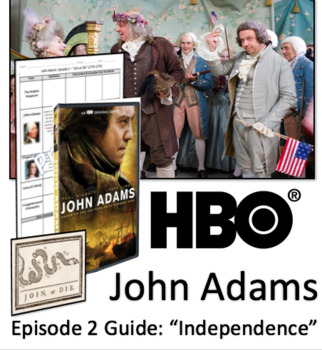
John Adams HBO Series Episode 2 - "Independence" Video Graphic Organizer
Do your students struggle to keep up with answering video questions?
These graphic organizers are printable handouts that students can use to record what they've learned about each president while watching the show.
Most students need time to process and think about what they are watching before writing it down. The graphic organizer format allows the students freedom to write down what they learn, and reduces the anxiety of "missing what the speaker said".
What I love most about this type o
Subjects:
Grades:
8th - 12th
Geographical Features of Earth - PowerPoint and Activities
Great science unit on describing geological features of Earth, including bodies of water, beaches, river, lakes, ocean ridges, continental shelves, plateaus, faults, canyons, sand dunes, island, peninsula, mountains, hills, plains, plateaus, and ice caps.
All taught with a PowerPoint and printable that go along with it to make sure the students understand objectives above. If you have this objective in your state. You can cover it with this PowerPoint and activity sheets very easy! I love easy
Subjects:
Grades:
3rd - 9th
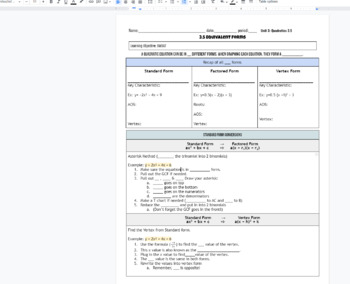
Converting between 3 forms of quadratic equations (equivalent functions) notes
Unit 3: 3.5 Converting between 3 forms of quadratic equations (equivalent functions) notes. In these scaffolded notes / graphic organizers students convert between standard, factored, and vertex form quadratic equations. The notes are broken up to show the steps on how to go from one to another. This also tells how a parabola can look like 3 different equations.Doc is editable. KEY is included in title and at the bottom of the doc. math 2 HS class. (see 3.1, 3.2, 3.3, 3.4 for previous notes!)
Subjects:
Grades:
7th - 12th, Higher Education, Adult Education
CCSS:
Also included in: Quadratic Forms & Characteristics Unit Notes & Homework
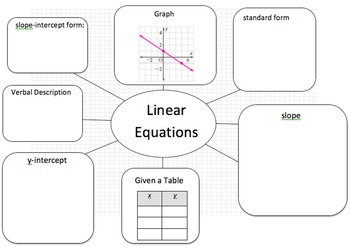
Linear Equation Web - Translate Between Linear Representations
This activity is an organized way to have students translate between various representations of a linear function (COMMON CORE F8.2; F8.3 and ALGEBRA 1 Standards). The idea plays on the outline web used to plan a five paragraph essay. I have used this as individual assignments, but the most effective strategy is to work in small groups or centers. The students have a great time helping each other if made into a game with prizes! I have included a blank web for you to be creative! Sometimes, I ha
Grades:
7th - 10th
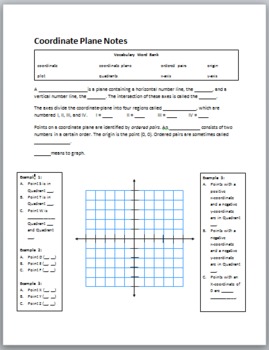
Coordinate Plane Cloze Notes for Students
These notes go with the coordinate plane powerpoint. Students will in the notes as the teacher presents the powerpoint. This can be used to teach 6th grade common core, 6.NS.6, graphing on a coordinate plane. It can also be used to review graphing on the coordinate plane prior to teaching 7.RP.2, 8.G.2, 8.G.3, 8.G.4, 8.G.8, 8.F.4, 8.F.1, 8.EE.5, 8.EE.6, 8.EE.7, or 8.EE.8.
Grades:
6th - 8th
Types:
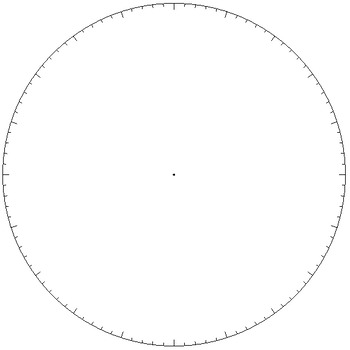
Pie Chart / Circle Graph - Simple Template
Pie graphs can be tricky to make by hand when the sections aren't easy fractions of the pie. This simple template gives a circle marked off with 100 'tick lines' for easy graphing of percentages of the whole pie. A second template using dots is included too. A dot in the centre of the circle is included too, making it easy to use a ruler and draw lines out to the edge.
It's a .docx (Word) file containing two images. Feel free to copy, paste, modify, distribute, embed...
~CalfordMath
If
Subjects:
Grades:
Not Grade Specific
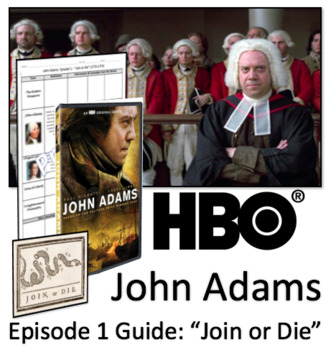
John Adams HBO Series Episode 1 - "Join or Die" Video Graphic Organizer
Do your students struggle to keep up with answering video questions?
These graphic organizers are printable handouts that students can use to record what they've learned about each president while watching the show.
Most students need time to process and think about what they are watching before writing it down. The graphic organizer format allows the students freedom to write down what they learn, and reduces the anxiety of "missing what the speaker said".
What I love most about this type o
Subjects:
Grades:
8th - 12th
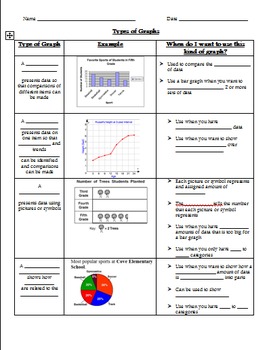
Types of Graphs Graphic Organizer
Multiple graphic organizers included. Students explore various types of graphs and learn about the characteristics and advantageous traits of each type, including line plot, histogram, line graph, circle graph, bar graph, stem-and-leaf plot, and double line graph. There are two types of graphic organizers included. The first is a basic graphic organizer that can also be used as an assessment in which students just identify the type of graph. In the second graphic organizer, students fill in key
Grades:
3rd - 7th
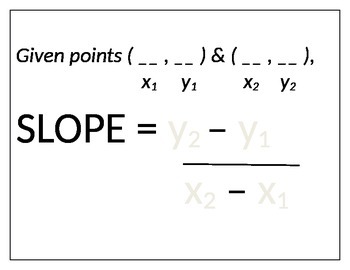
Slope Mats: a hands on "puzzle" manipulative for the slope formula
When students begin using the slope formula, getting the right numbers in the correct locations can be difficult for many. Help your students get a handle on this--literally--with this hands on puzzle approach to filling in values in the slope formula. Great for kinesthetic learners. By Michelle Fries
Grades:
7th - 9th, Adult Education
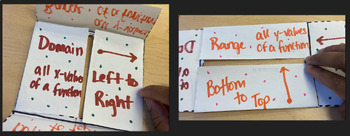
Domain and Range Foldable
This activity can be used as an interactive notebook insert. Students can use the foldable on top a graph of a function, and create a visual representation of both the domain and range. This activity promotes critical thinking, differentiated instruction, and use of visual aid
Subjects:
Grades:
10th - 12th
CCSS:
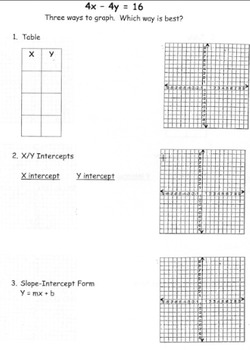
Linear Equations: Graphing 3 Ways Worksheet/Organizer
"Graphing 3 Ways Worksheet/Organizer" (8 Worksheets included)
These worksheets are a great way to bring together everything the students learned about graphing linear equations. It will review graphing using a table, using intercepts and slope intercept form. By graphing the same equation 3 different ways, the students realize that no matter which form you graph the equation in, you will always get the same line. All 3 graphs should match. (This is also a great way for the students to be a
Grades:
8th - 10th
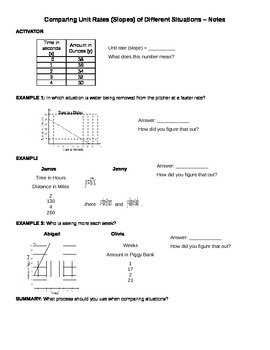
Comparing Unit Rates Notes
This document is the notes that go with the Comparing Unit Rates or Slopes in Different Situations PowerPoint that models and guides comparing linear relationships in different forms (tables, equations, and graphs) to see which function has the greatest slope. This PowerPoint is meant to be used with common core math standards 8.EE.5, which is 8th grade standard math or with 7th grade accelerated math. This PowerPoint is meant to be used with the comparing unit rates notes, which students fill i
Grades:
7th - 8th
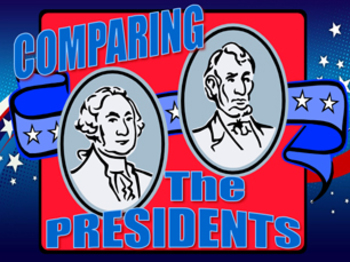
President's Day: Comparing The Presidents (Washington/Lincoln) Venn Diagram PPT
History Made Fun!
Here is an engaging Powerpoint presentation that highlight interesting facts about our 1st and 16th presidents.
This is a 20-slide show that compare and contrast 16 facts about Washington and Lincoln, each presented in a Venn diagram. Presentation includes vibrant and fully animated graphics to engage your students!
Some of the comparisons include: Birthdays, social status, education, religion, views on slavery, political party affiliation, military service, presidential
Subjects:
Grades:
K - 12th
Showing 1-24 of 348 results


