16 results
Higher education Common Core HSS-CP.A.2 microsofts
Statistics Unit 4 Bundle - Probability Counting Methods Curriculum (10 days)
Statistics Unit 4 Bundle - Probability Counting Methods Curriculum (10 days)
This is a unit plan bundle for a Statistics class. The plans include common core math standards, time frame, activities, enduring understandings, essential questions, and resources used. It is designed to last two weeks. The plans include:
35-slide presentation, with annotated guide for reference
4 Worksheets
"Do Now" Entrance problems
2 quizzes
Graphing Calculator Activity/Walkthough
Review slides (for response syst
Subjects:
Grades:
9th - 12th, Higher Education
CCSS:
Probability Bundle - PowerPoint, HW, Quizzes with Answer Keys
This bundle contains all the probability work I have posted from my Probability & Statistics course, including the answer keys that go along with it.
Subjects:
Grades:
10th - 12th, Higher Education
CCSS:
Statistics Unit 5 Bundle - Probability Curriculum (15 days)
This is a unit plan bundle for a Statistics class. The plans include common core math standards, time frame, activities, enduring understandings, essential questions, and resources used. It is designed to last 15 days, depending on pacing. The plans include: 56-slide presentation, with annotated guide for reference7 Worksheets"Do Now" Entrance problems4 quizzesLaw of Large Numbers Activity Worksheet (Drawing Hearts)Review slides (for student-group presentations, review handout included)Unit test
Subjects:
Grades:
9th - 12th, Higher Education
CCSS:
Probability Bundle - PowerPoint, HW, Quizzes
This bundle contains all the probability work I have posted from my Probability & Statistics course.
Subjects:
Grades:
10th - 12th, Higher Education
CCSS:
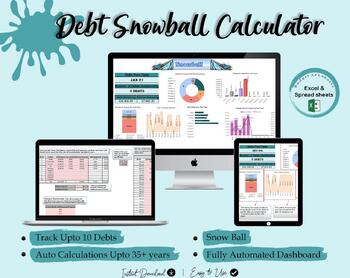
Debt Snowball Google Sheet | Debt Tracker | Debt Payoff Tracker | Debt Payoff
Debt Snowball | Debt Tracker | Debt Payoff Tracker | Debt Payoff | Debt Spreadsheet | Debt Google Sheet | Debt Payment Tracker ✨ Debt Snowball Google Sheet ✨This debt snowball Sheet objective is to help you understand how much debt you have, how long it will take to pay it off, and which debts to pay off first.This debt snowball Sheet will track your debt & let you know how long it will take to become debt free, how much interest you will pay, and the projected payment for each loan.✨FEATURE
Subjects:
Grades:
Higher Education, Adult Education, Staff
CCSS:
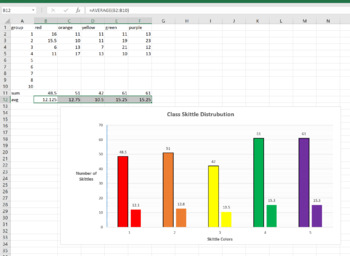
Skittle Statistics MS Excel Mini-Lab
This is a 1 class MS Excel lab for a computer or math class. You can have the students explore the distribution of different color Skittles in class. This is a great mini-lab or half-day activity when you school ends up with a weird schedule day. Tell them they can't eat till the Skittles till the end of class, or they will distort their numbers. Also make sure they don't throw them or shove them up their nose (Yes, stuck Skittles are hard to extract, ask me how I know..)The goal of this lab is
Grades:
6th - 12th, Higher Education, Adult Education
Types:
NGSS:
MS-ETS1-2
, HS-ETS1-2
, HS-ETS1-3
, MS-ETS1-4
, MS-ETS1-1
...
Also included in: Hands-on Science Semester Labs Bundle
AP Statistics Lessons
This set of PowerPoint presentations includes all the lessons and homework assignments I developed to teach AP Statistics. Each lesson includes lesson goals, lecture materials, bolded key definitions, activities (including links to actual, relevant AP problems by section), and homework assignments.
You could use these lessons to teach in its entirety a year-long AP Statistics course, or a college-level Statistics 101 or even a HS-level non-AP statistics course with minor tweaking. I generally d
Subjects:
Grades:
9th - 12th, Higher Education, Adult Education
CCSS:

6 Editable Bar Graph Templates 2.0
Finally a simple and professional graph space that students can fill out without any design issues getting in the way. This file contains 6 ready-to-use graph options. Print them and have students fill them with pencil and ruler, or distribute them over computer and let them practice entering the data. Get a project perfect finish every time. Maybe you just want to fill it out live on a projector? The possibilities are endless! It's okay to say you love these bar graphs. So do we.Contains:- 2 bl
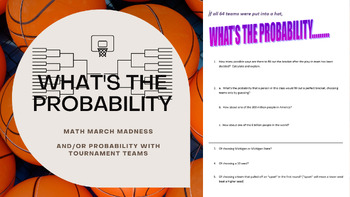
Math March Madness - What's the Probability (and/or Conditional Probability)
A good excuse to talk tournament! This activity asks probability and conditional probability ("and"/"or") questions with a March Madness theme! It assumes that all teams are put into a hat - so they have even probabilities. You may want to discuss how the tournament is set up and define terms like "seed", "upset" and "conference" - or let students do some quick research to learn more. This item is editable so you can choose your own regional teams. On occasion I've streamed the tournament g
Subjects:
Grades:
6th - 12th, Higher Education
Types:
CCSS:
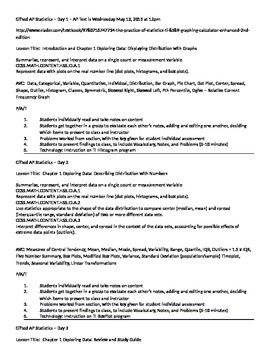
AP Statistics Lesson Plans for 29 Days with CCSS Included
Lesson Plans for High School teachers of AP Statistics. Includes the first half of the course. Common Core State Standards are included for every lesson. Easy to copy and paste into school district lesson plan site. Includes technology, group work, peer evaluation, independent study, and a common sense approach to the day by day student lead teaching of the AP Statistics course. Great template for COMPASS.
Subjects:
Grades:
12th, Higher Education
Types:
CCSS:
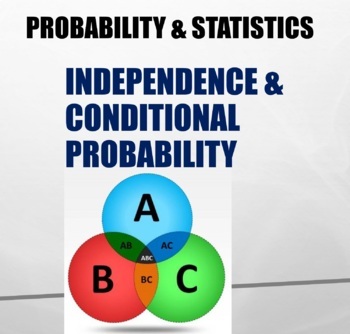
Probability & Statistics: Independence and Conditional Probability
Covers probability including:- Mutually exclusive events- Independent and dependent events ("A given B")- Unions- Intersections- Sampling with and without replacement- Addition Rule- Multiplication RuleExamples with die, cards, lottery and many others. Slides are animated, showing step-by-step how to perform calculations. I used these slides for my high school statistics class (10th-12th grade).
Subjects:
Grades:
10th - 12th, Higher Education, Adult Education
CCSS:
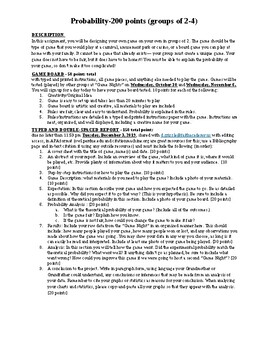
Bluman Statistics Chapter 4 Project
This is a Microsoft Word document, so it can be edited to fit your own classroom needs. It is a project I used in my 12th grade Statistics class. I gave it out the second week of second quarter and set aside one day a week to work with my students on this project through all of first quarter. I also hosted "Game Nights" in which we played and collected data from the games that were created for this project.This project is aligned with chapter 4 of Elementary Statistics: A Step by Step Approach 8
Subjects:
Grades:
11th - 12th, Higher Education
Types:
CCSS:

More Probability Rules Power Point
This Power Point goes through the rules for when we add or multiply in probability, mutually exclusive events, conditional probability, and using conditional probability to test for independence. Examples are included as well as the answers for the examples.
Subjects:
Grades:
9th - 12th, Higher Education
Types:
CCSS:
Also included in: Probability and Statistics PowerPoints
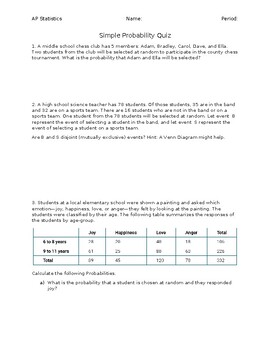
Statistics Simple Probability Quiz
Conditional probability quiz for statistics, and higher math courses. This quiz assesses independence, conditional probability, probability tree creation and utilization, mutually and exclusive events.
Subjects:
Grades:
11th - 12th, Higher Education
Types:
CCSS:
SPSS software Secondary Data Analysis Workshop (Introductory/AP Statistics)
This handout is intended for those interested in teaching/learning basic introductory statistics concepts to analyze real data. Students will learn how to tell a story using secondary data analysis. The handout is for SPSS and the US Longitudinal Study of Adolescent Health data set. For handouts on the data set code book and raw data file, a PowerPoint to accompany the handout, or questions please email kristin.flaming@gmail.com or ldierker@wesleyan.edu.This handout was developed as a condensed
Subjects:
Grades:
6th - 12th, Higher Education, Adult Education
Types:
R software Secondary Data Analysis Workshop (Introductory/AP Statistics)
This handout is intended for those interested in teaching/learning basic introductory statistics concepts to analyze real data. Students will learn how to tell a story using secondary data analysis. The handout is for R or R Studio, a free cloud based system and the US Longitudinal Study of Adolescent Health data set. For handouts on setting up a free R account, the data set code book and raw data file, a PowerPoint to accompany the handout, or questions please email kristin.flaming@gmail.com or
Subjects:
Grades:
6th - 12th, Higher Education, Adult Education
Types:
Showing 1-16 of 16 results

