892 results
High school statistics resources for Microsoft PowerPoint
Statistics Project - Statistics Olympics
Engage your students in their study of statistics as they compete in self-created Olympic style events. This project will engage students and help them discover meaning and apply concepts including measures of central tendency, quartiles, outliers, variance, standard deviation, z-scores, box plots, histograms, normal and skewed distributions. This project can be completed in approximately 6-8 days (50-min class periods) ** March 2023 Update **Visual updates to all slides and documentsRubric ali
Subjects:
Grades:
6th - 12th
CCSS:
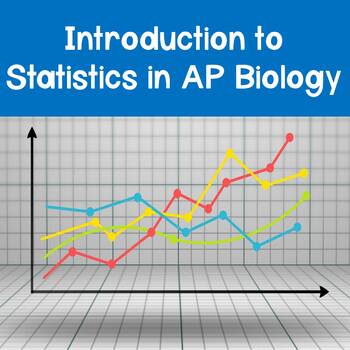
AP Biology Introduction to Statistics PowerPoint
The AP Biology* exam has been updated for the 2019-2020 school year. You can find the updated course description guide here. Make sure that you and your students are prepared for these changes. Save countless hours of research aligning your content to the new AP Biology* course outline by purchasing this resource. This resource includes everything your students need to know to master statistics related to AP Biology*.Included in this PowerPoint for the Introduction to Statistics in AP Biology* a
Subjects:
Grades:
9th - 12th
Types:
Also included in: AP Biology PowerPoints- FULL YEAR Bundle- Distance Learning Compatible
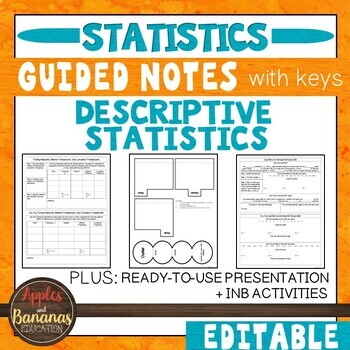
Descriptive Statistics- Guided Notes, Presentation, and INB Activities
This Introduction to Statistics product is flexible, editable, and can be used for in-person or distance learning. Take the time and stress out of creating your own guided notes and presentations. There are many ways to use this engaging bundle. It includes guided notes embedded with student practice problems (keys included), foldable activities, and a PowerPoint presentation for focused instruction. Choose what works best for your class/student and modify to make the content fit your needs. Not
Subjects:
Grades:
9th - 12th
CCSS:
Also included in: Custom Bundle for Viet
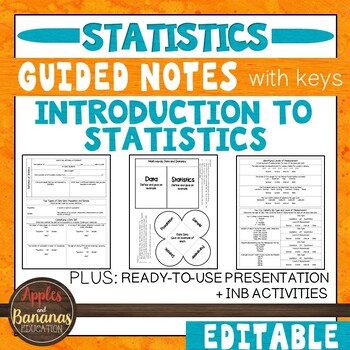
Introduction to Statistics - Guided Notes, Presentation, and INB Activities
This Introduction to Statistics product is flexible, editable, and can be used for in-person or distance learning. Take the time and stress out of creating your own guided notes and presentations. There are many ways to use this engaging bundle. It includes guided notes embedded with student practice problems (keys included), foldable activities, and a PowerPoint presentation for focused instruction. Choose what works best for your class/student and modify to make the content fit your needs. Not
Subjects:
Grades:
9th - 12th
CCSS:
Also included in: Custom Bundle for Viet
Chi Squared
Chi SquaredTeaching Chi Squared to a Stats class or AP Bio and not sure where to start?! Well, you found it. I created this product for my husband, who teaching AP Biology. This pack includes a PPT introduction, complete with student fill-in-the-blank notes, that walk students through the steps of Chi Squared and gives them a general overview of how and why we use this test. Degrees of Freedom are explained, as well as p-value. Notes provide an additional practice problem to do as a class. This
Subjects:
Grades:
9th - 12th
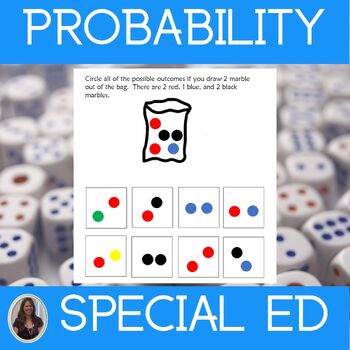
Probability for Special Education PRINT AND DIGITAL
This unit on Probability has almost 200 pages and 74 google slides of material specifically designed for students with special learning needs, especially autism who are in middle and high school. This unit helps students understand how to determine the probability of an event and all the possible outcomes. There are differentiated versions of the worksheets that use pictures and color coding. There are many ways for students to practice these skills in this unit that are at different levels.
Subjects:
Grades:
7th - 9th
Probability - Tree Diagrams for independent and dependent events
To save you some time when you are preparing your lessons on dependent and independent events, I have collected a bunch of problems that can be solve by drawing tree diagrams and made a slide show of the questions and there answers. The tree diagrams are animated to enable you to explain as you go on. They can also be adjusted very easily and quickly to fit any other problems that you want you learners to solve.There are 6 examples of dependent events and 9 of independent events. I have also inc
Subjects:
Grades:
7th - 12th
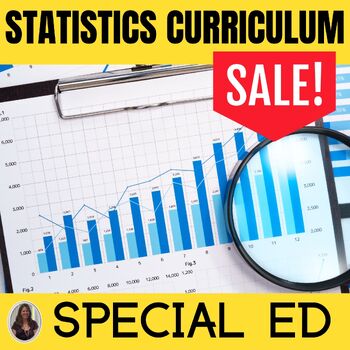
Statistics Curriculum Statistics and Probability Special Ed Math Curriculum
Save $$$ with this Statistics Curriculum. This special ed math curriculum contains 8 units from my series on statistics including statistics and probability. They were developed for students with autism and special learning needs in middle and high school. Each unit is structured in the same way with similar content to enable your students to make connections and build on what they learn in each unit. This repetition of format helps ease anxiety and free up mental space when learning more di
Subjects:
Grades:
8th - 10th
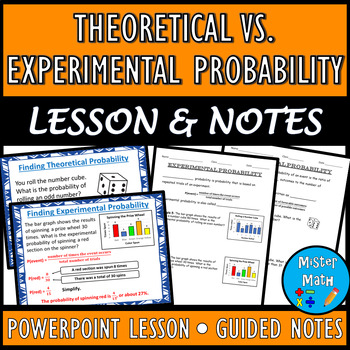
Theoretical vs. Experimental Probability PPT & Guided Notes BUNDLE
This BUNDLE includes a PowerPoint Lesson and a corresponding Guided Notes Packet to assist students in learning about theoretical and experimental probability. Students will learn the concepts of theoretical and experimental probability, as well as how to find the probabilities of each. Plenty of real-life examples are included to give students ample opportunities to practice the skills. Overall, the 21-slide PowerPoint and 6-page guided notes packet covers the following topics:Theoretical Proba
Subjects:
Grades:
6th - 9th
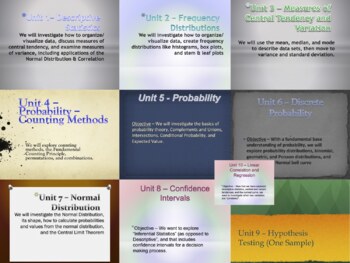
A Mountain of Statistics Curriculum - One Full Year Bundle
This is a bundle of 10 Units, Midterm Exam, & Final Exam designed for a high school Statistics Class (can be applied to University discipline). Each unit plan includes Common Core Standards, Key Concepts/Enduring Understandings, Essential Questions/Do Now, Activities, Resources, Procedures, and Assessment techniques. It is designed to be a lifelong tool that you can add to, edit, and re-use every year! Please see each Unit Statistics Product in the MountainWorks Store (sold separately) for
Subjects:
Grades:
9th - 12th, Higher Education
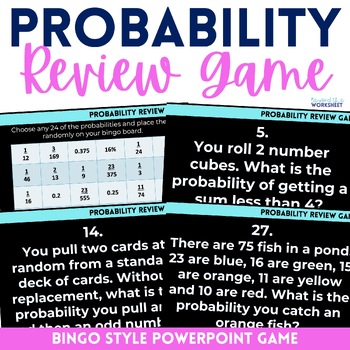
Probability PowerPoint Review Math Game
⭐️ This probability game is a fun way for students to practice or review probability skills. Included are basic and compound probability questions. ⭐️ Students must choose 24 of 30 probabilities to include on their Bingo card. The PowerPoint includes 30 questions for them to solve in order to play Bingo. ⭐️ Included in the file is the PowerPoint, Bingo Card and Answer sheet. Available in the following bundle: 7th Grade Curriculum Resources Mega BundleLicensing Terms:By purchasing this product, y
Subjects:
Grades:
7th - 9th
Also included in: 7th Grade Math Curriculum Supplemental Activities Bundle
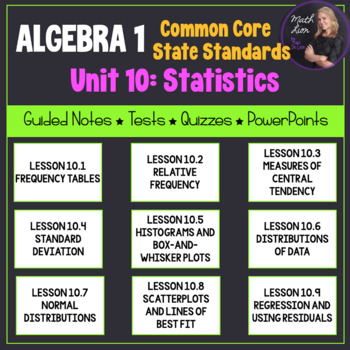
Statistics (Algebra 1 Curriculum - Unit 10) | Bundle for Common Core
This is a great unit that covers a Statistics unit in an Algebra 1 course! 9 lessons are included!All documents are EDITABLE!Included:- Overview of the common core alignment (PDF)- Guided notes for 9 lessons (PDF and Word)- PowerPoints that coordinate with the guided notes (PPTX)- Mid-Unit Quiz (PDF and Word)- Unit Test (PDF and Word)-Pacing Guide (PDF and Word)Each lesson contains a learning scale, warm up (do-now or bell ringer), key concepts, vocabulary, and examples for students to follow w
Subjects:
Grades:
7th - 12th
CCSS:
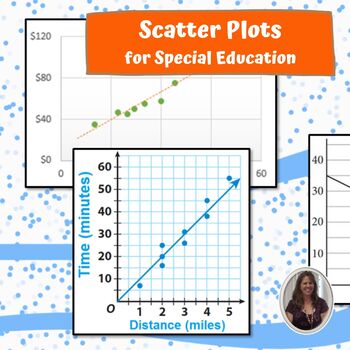
Scatter Plots for Special Education PRINT AND DIGITAL
This unit on Scatter Plots has almost 200 pages and 72 slides of material specifically designed for students with special learning needs, especially autism who are in middle and high school. This unit focuses on helping students interpret and read scatter plots. There are differentiated versions of the worksheets that use pictures and color coding. There are many, many worksheet for students to practice in this unit that are at different levels. There are MANY opportunities for students to e
Subjects:
Grades:
8th - 10th
Goldie's AP® Statistics Review Lessons and Homework
AP StatisticsUnit Review Lessons and Homework Assignments You can use these resources:throughout your year in AP Statistics, as a way to review before quizzes and testsas end of the year AP Exam reviewas an independent study guide resource for students Note: These resources are included in their respective unit plans. You get a total of 21 individual resources in this amazing bundle. There are 9 units in the AP Statistics course, and each unit comes with the following:PowerPoint presentation rev
Subjects:
Grades:
11th - 12th
High School Math Topics: STATISTICS & PROBABILITY
This is a collection of 19 Powerpoint Presentations to clearly explain STATISTICS and PROBABILITY topics in high school Math. These are also available individually, and also as part of the complete "Math Topics for High School Math" Product- also available elsewhere in my shop on this site.I sell these materials commercially for a much higher price, so these are very heavily discounted to allow all teachers to be able to access these for their own use.The titles of the 19 powerpoints are:Averag
Subjects:
Grades:
8th - 11th
Types:
Probability project using Real-World March Madness Tournament
Jump into the March Madness tournament to apply probability concepts to a real-world application. Great for your sports-loving students. Students explore probability first by determining the probability that a team will win. Students, further, weight teams based on historical data and/or team statistics. This mini-project allows for creative problem-solving and has some open-ended answers.Included in this resource:★ Student pages for 3 March Madness related activities★ Detailed guidelines fo
Subjects:
Grades:
7th - 10th
Types:
Also included in: 7th Grade Math Resource Bundle
Shapes of Distributions and Measures of Center Scavenger Hunt and Presentation
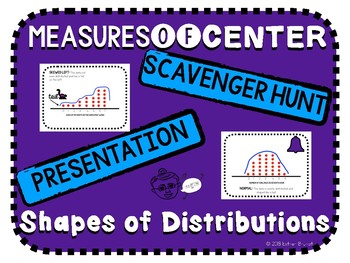
A note to the teacherThis resource is for teaching shapes of distributions, analyzing the use of the mean versus the median, and deciphering which among the two is higher based on the shape of the distribution.This resource includes:Keynote and Powerpoint Presentation & PDF(Animated)Shapes of DistributionsNormalSkewed LeftSkewed Rigt2 Examples EachWhich Measure of Center is More Appropriate (Mean vs Median)6 Example Knowledge Check Which Measure of Center is Higher (Mean vs Median)?6 Example
Subjects:
Grades:
8th - 12th
Also included in: Math Activity Bundle
Alien Punnett Square Activity
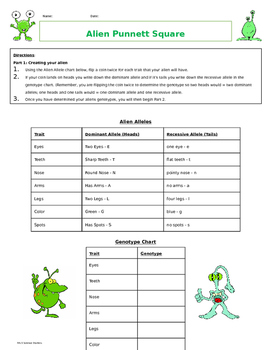
This is a fun way to teach or reinforce Punnett squares. Students will be creating an alien based on genotypes picked by tossing a coin. Then use those genotypes to draw an alien. Once everyone has their alien, they will then "breed" their aliens to produce offspring. Students can use this activity to learn about...- Punnett squares- Probability- Genetics and HeredityIt is also a great tool for interdisciplinary lessons incorporating math (probability), science (genetics), and art (drawing).As a
Subjects:
Grades:
6th - 9th
Types:
CCSS:
The Empirical Rule- Normal Distribution Foldable & Powerpoint
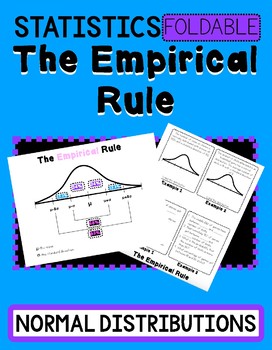
This resource is for the empirical rule. Students will label normal distributions with 2 real-world scenarios.This resource is accompanied by an animated Powerpoint and or Keynote file to present in the classroom. The presentation includes 8 additional examples. All answer keys are included.Printing:When printing the foldable set the printer to flip on the short side. You will fold the paper “hamburger” style just enough to show the title, The Empirical Rule.Sign up for my email list for freebie
Subjects:
Grades:
8th - 10th
Algebra 2 Honors Course
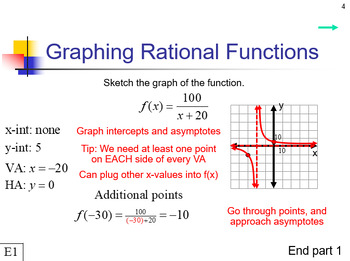
Bundle of resources for an Algebra 2 Honors Course. Includes the following (note that all resources can be edited, equations may require MathType):8 Chapters (see this Course Page for the full breakdown and companion YouTube videos)1 Functions2 Factoring3 Complex Numbers4 Quadratics5 Polynomials6 Rational Functions7 Trigonometry8 Statistics and ProbabilityEach lesson includes:PowerPoint presentation for the lesson itselfWord Guided Notes to go with lessonWord handouts for two homework assignment
Subjects:
Grades:
9th - 12th
Introduction to Factorials and Permutations Presentation, Notes & Practice
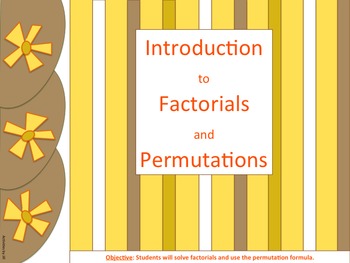
Focus of Lesson: Calculate factorials and use the permutation formula.
Lesson: Use the PowerPoint presentation with layered animation accompanied by a whole class discussion.
Alternate Lesson: Does your school have one-to-one computing? Have students view the presentation on their own device. This option allows students to proceed at their own pace and ask the teacher for clarification as needed.
Presentation: Slides 1-3
Student Note-taking Outline: Slides 4-5
20 Practice Problems: Slides
Subjects:
Grades:
8th - 12th, Higher Education
Two-Way Tables and Probability Lesson
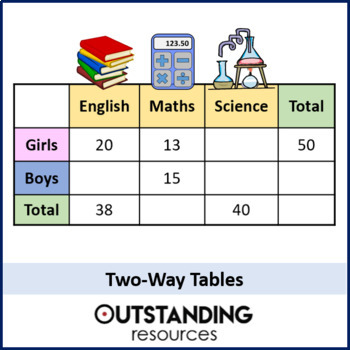
This is a whole lesson looking at the different aspects of Two-Way Tables. This is a way of displaying data and questions are often more varied than some students may think. The lesson covers three main types of questions 1) Filling in missing data 2) Reading data from a two-way table 3) Taking figures out of a worded context and putting it into a two-way table in order to solve a probability. This lesson is ready to go, with no prep required. It is also great for home learning and flip learnin
Subjects:
Grades:
6th - 10th
Also included in: Statistics ALL LESSONS
Probability Review Game
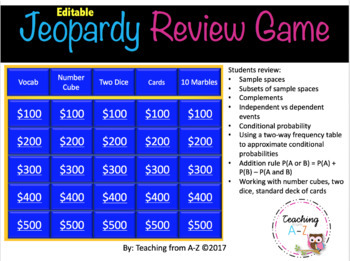
Use this Jeopardy-like review game to improve your students' understanding of key concepts in probability. This is a fun way to have students review:*Sample spaces*Subsets of sample spaces*Complements*Independent vs dependent events*Conditional probability*Using a two-way frequency table to approximate conditional probabilities*Addition rule P(A or B) = P(A) + P(B) – P(A and B)*Working with number cubes, two dice, standard deck of cardsThis is a PowerPoint Presentation. You can EDIT the problems
Subjects:
Grades:
9th - 12th
Also included in: Algebra Review Game Growing Bundle
Basic Statistics Year Long Lesson Plan Bundle
Prepare to embark on an exhilarating journey through the realm of statistics with our meticulously crafted nine-lesson plan designed to engage and captivate your students' minds. Each session is a vibrant exploration of statistical concepts, infused with excitement, interactivity, and depth. From introducing the basics of data analysis to delving into advanced techniques, our lessons are brimming with hands-on activities, animated discussions, and real-world applications that will ignite a passi
Subjects:
Grades:
11th - 12th, Staff
Showing 1-24 of 892 results

