12 results
10th grade graphing Common Core 8.SP.A.4 resources

Scatter Plot and Bivariate Data Research Project
Students will begin a statistics project on one of their favorite restaurants or food chains! They will be researching nutrition facts and surveying others on what types of food they like to eat there. Through this data collection they will work on their skills of creating scatter plot graphs, creating relative frequency tables, and analyzing this data. This can be used either by paper or digitally. I used it the last two years during distance learning. Rubric included.
Subjects:
Grades:
7th - 12th
Types:
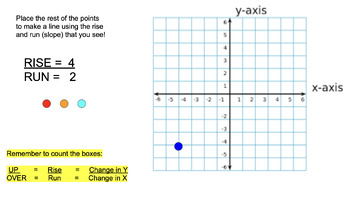
Coordinate Plane, Slope, Rise/Run, Graphing - Online No Prep Bundle
A bundle of activities which can be used as formal lessons or independent practice. Great for Google Classroom or Smart-boards! Also can be used as sub plans! Created by a Special Education Math Teacher to help students become comfortable with graphing!
Grades:
5th - 12th
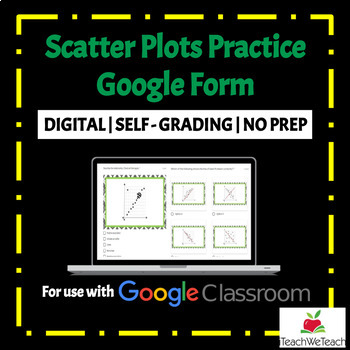
Scatter Plots | Google Forms Activity
★ DIGITAL Math Resource★ Are you looking for quality, standards aligned math resources to use with Google Classroom™? This resource is a fun and engaging way for students for practice solving problems involving scatter plots. This product includes a Google Form with 20 questions about scatter plots. Problems cover correlation type, the line of best fit and predicting scatter plot values. Possible Uses:• Practice• Homework • Assessment• ReteachCheck out my other products HERE.Please review my ter
Subjects:
Grades:
7th - 12th
Types:
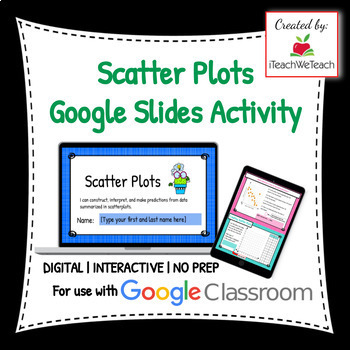
Scatter Plots Google Slides Activity | Interactive | No Prep | Download and Go!
★ DIGITAL Math Resource★ Are you looking for quality, standards aligned math resources to use with Google Classroom™? This resource is a fun and engaging way for students for practice solving problems involving scatter plots. This product includes a Google Slides activity with 19 interactive slides with questions about scatter plots. Problems cover correlation type, the line of best fit and predicting scatter plot values.To get the complete resource --> CLICK HERE!Possible UsesLesson & pr
Subjects:
Grades:
7th - 10th
Types:
Also included in: Statistics Bundle | Google Slides Activities | Download & Go!
Scatter Plots Worksheet Complete Lesson Pack (NO PREP, KEYS, SUB PLAN)
Scatter Plots Worksheet - Complete Lesson with No PrepHere’s a Complete Lesson Pack on how to solve Scatter Plots.This Complete Lesson Pack includes the following PDF Files:Lesson PlanPowerPoint PresentationGuided NotesPractice Worksheet (Version A)Practice Worksheet (Version B)Master Quiz*All PDF Files come with Answer Keys for easy grading and teachingIt also includes the following Links:Link to YouTube video that goes with this LessonLink to Online Interactive Quiz that goes with this LessonL
Grades:
6th - 10th
Line of Best Fit Worksheet Complete Lesson Pack (NO PREP, KEYS, SUB PLAN)
Line of Best Fit Worksheet - Complete Lesson with No PrepHere’s a Complete Lesson Pack on how to solve Line of Best Fit.This Complete Lesson Pack includes the following PDF Files:Lesson PlanPowerPoint PresentationGuided NotesPractice Worksheet (Version A)Practice Worksheet (Version B)Master Quiz*All PDF Files come with Answer Keys for easy grading and teachingIt also includes the following Links:Link to YouTube video that goes with this LessonLink to Online Interactive Quiz that goes with this L
Grades:
6th - 10th
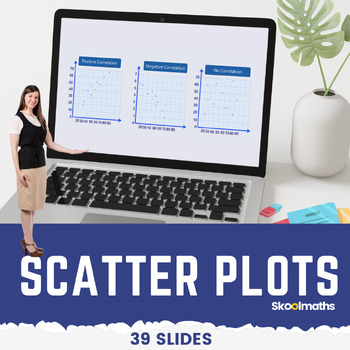
Eight Grade Scatter Plots Digital Math Lesson and Activities CCSS 8.SP.A.1
Eight Grade Scatter Plots Digital Math Lesson and ActivitiesTeach your high school grade how to use and interpret scatter graphs; recognize correlation; draw and use lines of best fit to make predictions?In this lesson, learners will be able to:use and interpret scatter graphs of bivariate data;recognize different types of correlation;draw estimated lines of best fit; anduse lines of best fit to make predictions.
Subjects:
Grades:
8th - 10th, Staff
Types:
CCSS:
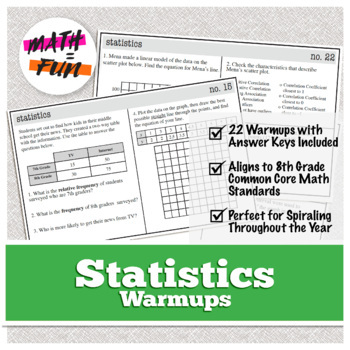
8th Grade Math Warm Ups | Statistics | Common Core Standards, Spiral
This warmup set has 22 half sheets with accompanying answer keys, covering the Systems of Equations standards for 8th grade Common Core. These warmups are great for practicing new concepts as well as for spiraled review throughout the year.How I use them:This set of warmups is great for review of the 8th grade Common Core standards each day. I have these waiting on the students' desks when they come in, and after a set amount of time we go over the answers together, usually with several students
Subjects:
Grades:
6th - 10th
Types:
CCSS:
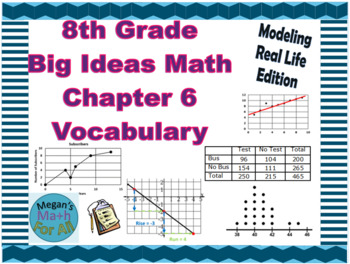
8th Grade Big Ideas Math Chapter 6 Vocabulary Cards-Common Core-MRL-Editable
Howdy,Update February 2024: I have added a Google Doc Version of the File. Now there are three files for every download: editable Word Doc, a link to an editable Google Doc, and a PDF.Are you using Big Ideas Math? Here are vocabulary cards for 8th Grade Chapter 6 (Common Core Edition and Modeling in Real Life). I used the terminology listed in the chapter and compared this list to the words contained in the Smarted Balanced item specs (SBAC). This will help prepare your students for the content
Subjects:
Grades:
8th - 10th
Types:
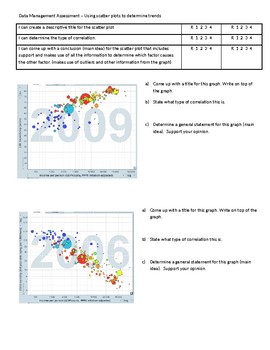
Finding Correlations in Scatter Plot Graphs using Gapminder
Students are presented with a series of scatter plots and asked to create a title and assess the type of correlation (strong, weak, positive, negative, no correlation). Students are also asked to write a brief main idea of what the graph is showing and support it with evidence.
Subjects:
Grades:
6th - 10th
Types:

Math Test Review/Prep Problems/Starters Grade 5 - 10
This Playlist of short videos are taken from released State End of the Year assessments for Grades 5, 6, 7, 8, 9 and 10. These problems check for understanding relative to what every student should know and be able to do. Each video is ONE question from a Common Core Aligned State Assessment. Each question is read and a modeled exemplar solution follows. Studies are showing that video instruction provides a more engaging sensory experience than print resources, an increase of knowledge rete
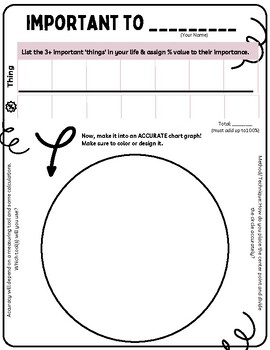
'Important to Me' First Day Activity- Chart Graph Assessment
This is a simple first day activity where students share in a table the things that are important to them, assign them a % value and visually translate on a chart graph. They can use the measuring tools of their choice to make it as accurate as possible.Preparation requires:1. Printing this handout and 2. Providing students with rulers, pencils, protractors, and compasses to choose from.Hints are placed around the chart to get students to think about how to chart graph.
Subjects:
Grades:
6th - 12th
Types:
CCSS:
Showing 1-12 of 12 results


