22 results
Kindergarten applied math Common Core 2.MD.D.10 resources
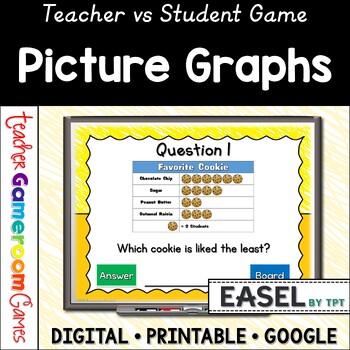
Pictographs Powerpoint Game | Picture Graphs | Digital Resources | Graphs & Data
Pictographs game! Students will answer questions about two picture graphs. Questions include most/least favorites, totals for each group, and comparing groups. There are 2 graphs in this game, each with 10 questions, giving you a total of 20 questions. The question disappears after you've clicked on it, so you know you've answered it. The scoreboard allows you to add scores during Slideshow Mode. Great digital resource for a quick math morning review or center activity. Great for individual prac
Subjects:
Grades:
K - 3rd
Also included in: Graphs Bundle | No Prep Digital Resources
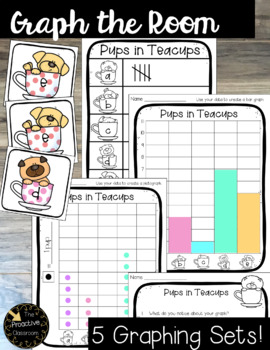
Graph the Room Data and Graphing Center (Bar Graph & Pictograph)
Graph the Room is a station activity that requires students to collect data, build a graph, and answer questions about the graph they built. 5 graphing sets are included in this pack Students can build a tally chart, bar graph, or pictograph for any of the 5 sets of data. Set Up:-Cut apart picture cards. Tape them around the room, on desks, or on your small group table. -Print the question sheet and the graph template sheet or sheets you want students to use.Play:-Students collect data by walkin
Subjects:
Grades:
K - 2nd
Types:
Also included in: Data and Graphing Centers - Activities Bundle
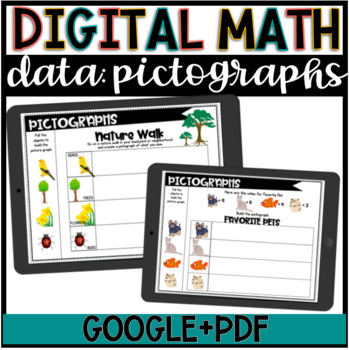
Digital Math//Pictograph Activity//Google Slide//DISTANCE LEARNING
Digital and remote learning is a reality. If you are using Google Slides for your remote learning leads, this is a great activity for data: pictograph length practice. This also makes a great math graphing center!! Data and Measurement plus graphing for distance learning!Need more Google slide resources? CLICK HERE!What is it? 5 data graph activities asking students to use pictures to build pictographs (picture graphs). 2 of the graphs are for students to go on their own data-collecting adventur
Subjects:
Grades:
PreK - 2nd
Types:
Also included in: Digital Math: Data Graphs Bundle
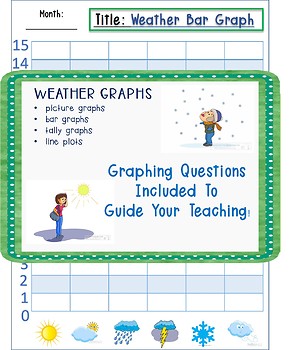
Graphing Weather- Line Plot, Bar Graph, Tallies, Pictograph
Students record the daily weather in my 2nd grade classroom using these graphs. The 2nd grade graphing standards include pictographs, bar graphs and line plots. I incorporate these graphs into my calendar routine. I switch them up each month and come back to the graphs that students find most challenging.
This packet includes
Picture Graphs
Bar Graphs
Tally Graphs
Line Plots
List of guiding questions
Represent and interpret data.
CCSS.MATH.CONTENT.2.MD.D.9Generate measurement data by meas
Subjects:
Grades:
PreK - 4th
Types:
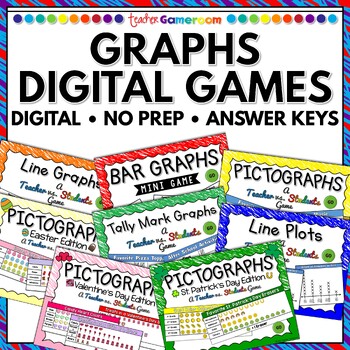
Graphs Bundle | No Prep Digital Resources
8 digital graphing games for one price. Graphs include Bar graphs, picture graphs, line graphs, line plots and more! Each digital game is ready to play immediately. No prep. Simply make this one-time purchase and you're ready to start off your science year great! Download games from my store as soon as they are available. This bundle is an EVERGROWING BUNDLE meaning any science game I make in future will automatically be added to this bundle! Games included:⭐️ Bar Graphs - Mini Game⭐️ Line Graph
Subjects:
Grades:
K - 5th
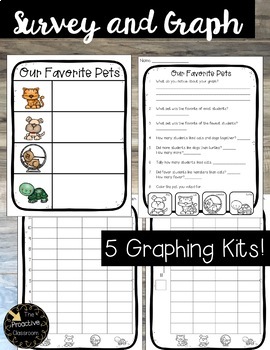
Survey and Graph Data and Graphing Center (Bar Graph, Pictograph)
Survey and Graph is a center or whole group activity designed to help students understand how graphs work., the elements of graphs, and what information you can learn from a graph. They can build tally charts, bar graphs, and pictographs and answer questions about what they learn. Set Up:-Print the graphing sheet or sheets and question sheet students will be working on. You can choose to have them work on one or multiple graph types.Play:-Survey the class by asking them to raise their hands or s
Subjects:
Grades:
K - 2nd
Types:
Also included in: Data and Graphing Centers - Activities Bundle
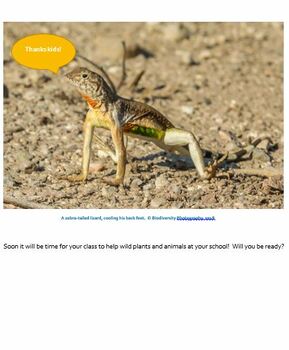
STEM/STEAM Backyard Data - Thinking Critically & Interpreting - Lesson 18
Students use a fun ancient art and applied math to gather and interpret baseline data on the plants living just outside the door. They solve the real-life Mystery of the Dead Birds using deductive reasoning, on-line research, and critical thinking. Your kids then turn to their own collected weather and biodiversity data. They graph, analyze, and interpret patterns to reach conclusions about how their local weather affects their neighborhood plants and animals. All lesson plans, printables, prese
Subjects:
Grades:
PreK - 6th
Types:
NGSS:
K-ESS2-1
, 2-LS4-1
, K-LS1-1
, K-ESS3-3
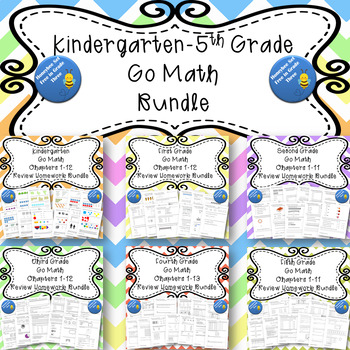
Kindergarten-Fifth Grade Go Math Chapter Review Homework BUNDLE
This is a bundle for ALL Kindergarten-5th Grade Go Math! chapter resources I have created. These math reviews are correlated to the Go Math! series. This bundle is geared towards those that teach math to multiple grade levels, switch grade levels frequently, or need to differentiate math due to various student math levels. This bundle includes reviews for all elementary grades Kindergarten-5th grade. Each review can be used as a homework assignment, an in class review, another form of the chapte
Subjects:
Grades:
K - 5th
Types:
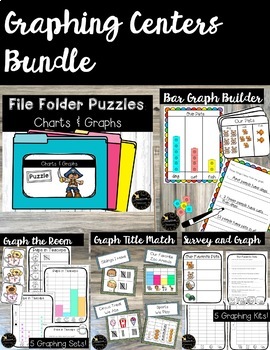
Data and Graphing Centers - Activities Bundle
This centers bundle includes everything you will need to help your students understand how bar graphs, pictographs, and tally charts work! It includes 5 unique center or small group activities that will help your students interact with, build, and read graphs and charts! Click on the links to see more information about each of the centers included in this bundle.1. File Folder PuzzlesThese file folder puzzles work wonderfully for math stations, small group lessons, and quick interventions. Set u
Subjects:
Grades:
K - 2nd
Types:
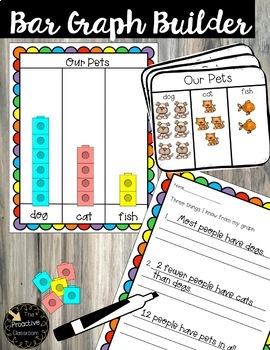
Bar Graph Builder + Pictograph Builder Data and Graphing Center
Bar graph builder is a center or whole group activity designed to help students understand how bar graphs work, the elements of bar graphs, and what information you can learn from a bar graph. What I love about this activity is how it requires students to do the thinking instead of just reacting to the questions someone else is asking about a graph. Students build a higher level of understanding about graphs and how they work.Set Up:-Print, cut, and laminate data cards-Print and place graph shee
Subjects:
Grades:
K - 2nd
Types:
Also included in: Data and Graphing Centers - Activities Bundle
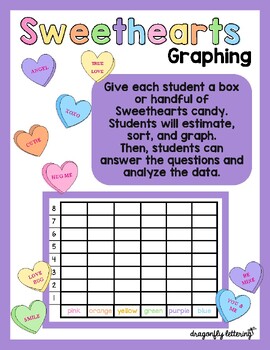
Sweethearts Candy Graph - Bar Graph, Line Plot, Picture Graph, Estimations
Estimating and Graphing Sweethearts CandyThis is a great Valentine's Day activity!Give each student a box or cupful of Sweethearts Candy to sort, graph, and analyze the data.Use these No PREP templates to create an academic-focused Valentine's Day project!Students will love that it involves candy and you will love that it involves math!This file includes:Estimations/Results Worksheet 4 graphing templates - differentiated questioning - one geared towards younger grades and one geared towards olde
Subjects:
Grades:
PreK - 8th
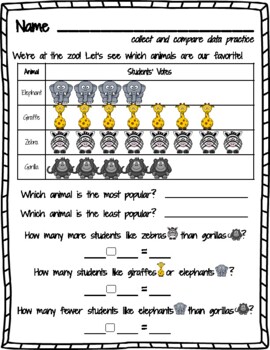
1st Grade Collect & Compare Data 6-Worksheet Packet!
Collect & Compare Data 6-page Packet, great for First (or second) Grade!Includes tally and number charts & picture and bar graphs. Questions ask to combine and compare numbers. Most questions use addition and subtraction within 10, some questions go up to 20, but students can use pictures to help count!
Subjects:
Grades:
K - 2nd
Also included in: 1st Grade GRAPHING DATA BUNDLE - collect & compare data
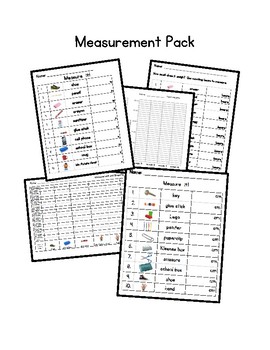
Measurement Pack
This pack contains recording sheets for the following:
*measuring classroom objects with standard units (inches and centimeters)
*weighing classroom objects with nonstandard units (counting bears)
*graphing to compare length of classroom objects in inches
*graphing to compare height of plants (bean, sunflower, pumpkin)
I use these recording sheets for Math and Science centers. My K, 1st, and 2nd graders love using them and working independently with a partner to record their measurements!
Subjects:
Grades:
K - 2nd
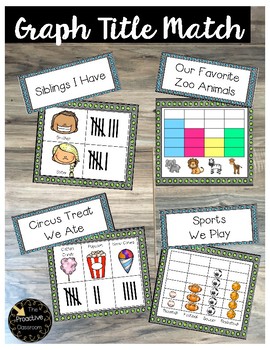
Graph Title Match Data and Graphing Center
In this activity, students match each graph with its title. This activity is great for helping students learn the importance of including a title with their graphs. You can also show a graph and ask students to predict what the title should be. Set Up:-Print, laminate, and cut out graph and title cards. Play:-Students can work in groups, independently, or as a class to match each graph with its title. You might also want to show a graph and ask students to predict what the title might be. This s
Subjects:
Grades:
K - 2nd
Types:
Also included in: Data and Graphing Centers - Activities Bundle
Graphing without Numbers - STEM
Title: Graphing Without Numbers: LUNAR STATION Theme / Topic: Graphs & Coordinate PlanesEssential Question: What do the marks on a graph represent? How can I use data to make decisions?Recommended Level: K-5Purpose: To introduce the concept of data-driven decision-making through graphs and charts.
Subjects:
Grades:
K - 5th
Types:
Graphing Galore! Student Centered (T-charts, Tally charts, Picture Graphs!)
This resource allows for the students to explore the world of data through their own interests! Students will be creating their own individual data questions to drive their data collection. Students will get to experience data hands-on!This activity can be used for a Math Project, Presentation Grade, Daily Activity, Review or Assessment!Includes:5 different versions allowing teachers to cater to the needs of their students! Teaching TipsLesson Plan!
Subjects:
Grades:
K - 3rd
Types:
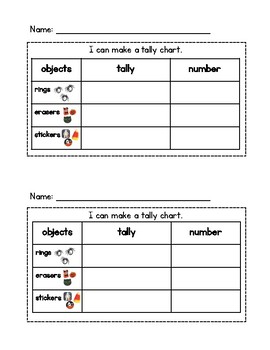
Halloween Tally Chart and Bar Graph
Halloween Tally Chart and Bar Graph
This document may be used for math or science centers/stations or for holiday class parties.
After download, print front to back so the tally chart and bar graph are on one half sheet of standard 8.5x11 paper.
Place Halloween rings, erasers, and stickers (no more than 10 of each object) into ziploc baggies.
Students will sort the Halloween objects into categories and show the number of each object on the tally chart using tally marks and written numeral.
Subjects:
Grades:
K - 2nd
Types:
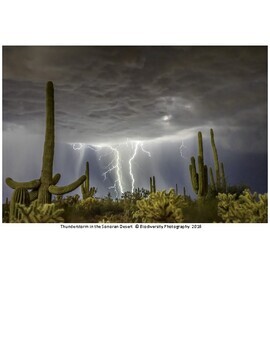
Weather Patterns - The Young Child Uses Their Own Data- STEM / STEAM Lesson 17
In this lesson, your students look for patterns revealed on their collected Daily Data sheets. First, they will use themselves as movable counting blocks to help think about how the weather affects their own behaviors. Then they analyze, graph, and interpret their accumulated Daily Data to reach logical conclusions about how changes in weather affect the local plants and animals in their schoolyard or backyard. Includes:Detailed Lesson PlanWeather & You Chart and QuestionsWhat Do You Wear C
Subjects:
Grades:
PreK - 6th
Types:
NGSS:
K-ESS2-1
, 3-ESS2-1
, K-LS1-1
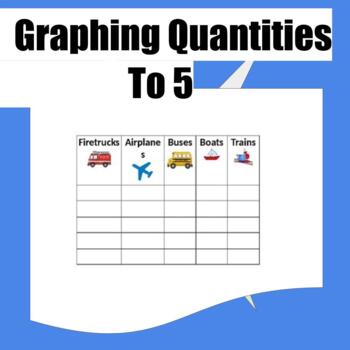
Comparing Quantities Bar Graph Activity
This bar graph math activity gives the student a math word problem to graph quantities to 5. The students will count how many pictures and write the number. They will compare quantities to determine more , less , and equal to. This can be printed as independent work and independent math practice. It can be laminated for reuse or written on. Follow me on Instagram @amandasspedadventures
Subjects:
Grades:
PreK - 1st
Types:
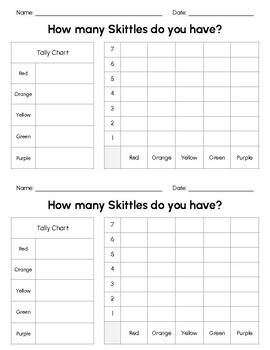
How Many Skittles Do You Have? Bar Graph
Used for small packs of Skittles. Saves paper, saves ink.Two in one sheet.
Subjects:
Grades:
K - 3rd
Types:
CCSS:
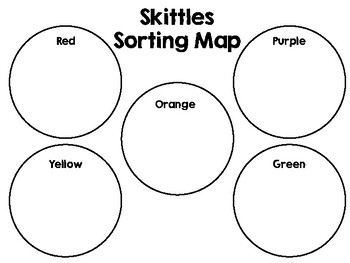
Skittles Graphing
Includes a sorting mat, graph template, and a question & answer sheet.
Subjects:
Grades:
K - 2nd
Types:
CCSS:
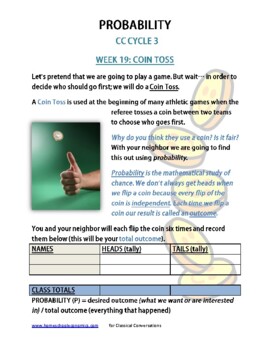
Probability (Classical Conversations Companion) - Cycle 3 Week 19
This is the introduction to probability, Week 19. Science experiments for Weeks 20 - 24 are available separately. Gain basic concept of probability and outcomes. Document outcomes. Working together for first activity.
Subjects:
Grades:
K - 6th, Staff
Showing 1-22 of 22 results


