31 results
4th grade applied math Common Core 2.MD.D.10 resources
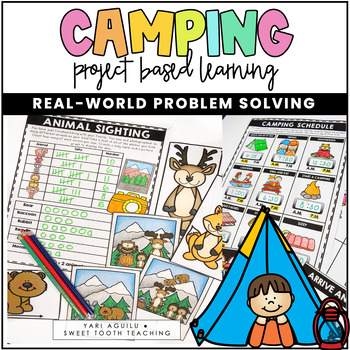
Project Based Learning- Camping Trip
Your students have decided to go on a camping trip! They will use real-life math skills to plan, design, and explore on their trip.This PBL (Project-Based Learning) project is perfect for second graders or early third graders. It can be used as a review of math skills learned throughout the year. Your kiddos will need to apply the following math skills in order to have a successful hiking trip:Telling TimeAdditionSubtraction Graphing- tally tables, pictographs & bar graphsLine PlotsMeasureme
Subjects:
Grades:
2nd - 4th
Types:
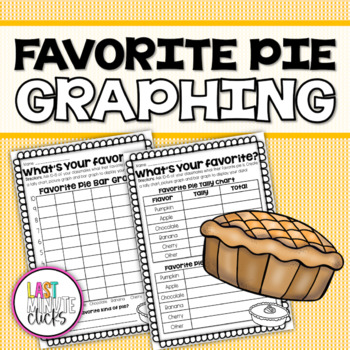
Favorite Pie Graphing Activity - Tally Chart, Picture Graph and Bar Graph
Favorite Pie Graphing Activity - Tally Chart, Picture Graph and Bar GraphThis Favorite Pie Graphing Activity will keep your students engaged and excited about graphing data! First, students will go around the classroom and survey their classmates by asking the question: "What is your favorite kind of pie?" Students will tally up the data on a tally chart. Then, students will record their findings and data on a picture graph and bar graph! Students will love learning about and relating to other s
Subjects:
Grades:
1st - 4th
Types:
CCSS:
Run A Business Project Based Learning
This is a Project Based Learning activity that teaches students about running their very own business! It focuses on collaborative opportunities through hands-on experiences for students to engage in their learning. Students will create a business plan and follow through by running their business. Project Based Learning: Run A BusinessThis product includes differentiated activities, math skills, reading, research, writing, vocabulary, problem solving, aligned with Common Core, and extension acti
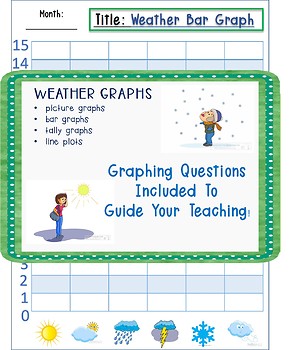
Graphing Weather- Line Plot, Bar Graph, Tallies, Pictograph
Students record the daily weather in my 2nd grade classroom using these graphs. The 2nd grade graphing standards include pictographs, bar graphs and line plots. I incorporate these graphs into my calendar routine. I switch them up each month and come back to the graphs that students find most challenging.
This packet includes
Picture Graphs
Bar Graphs
Tally Graphs
Line Plots
List of guiding questions
Represent and interpret data.
CCSS.MATH.CONTENT.2.MD.D.9Generate measurement data by meas
Subjects:
Grades:
PreK - 4th
Types:
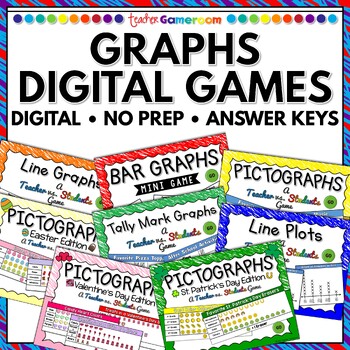
Graphs Bundle | No Prep Digital Resources
8 digital graphing games for one price. Graphs include Bar graphs, picture graphs, line graphs, line plots and more! Each digital game is ready to play immediately. No prep. Simply make this one-time purchase and you're ready to start off your science year great! Download games from my store as soon as they are available. This bundle is an EVERGROWING BUNDLE meaning any science game I make in future will automatically be added to this bundle! Games included:⭐️ Bar Graphs - Mini Game⭐️ Line Graph
Subjects:
Grades:
K - 5th
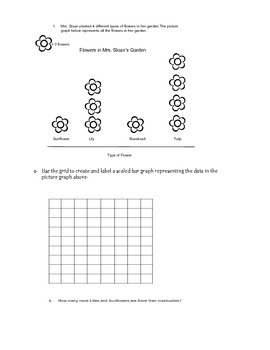
3rd grade module 6 graphs, data, CCSS assessment practice Eureka Math
This is the Eureka Math module 6, 3rd grade end of module practice test. If your students can pass this, they will be successful on the EOM assessment for Module 6.
You could also use it for a pre-test for 2nd grade or a review for 4th grade.
I also have Module 5 mid-module and eom available so far.
Subjects:
Grades:
2nd - 4th
Types:
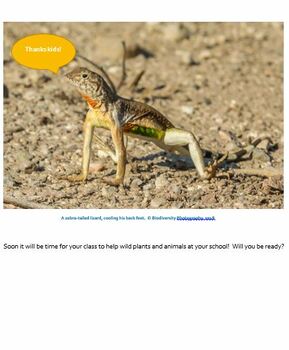
STEM/STEAM Backyard Data - Thinking Critically & Interpreting - Lesson 18
Students use a fun ancient art and applied math to gather and interpret baseline data on the plants living just outside the door. They solve the real-life Mystery of the Dead Birds using deductive reasoning, on-line research, and critical thinking. Your kids then turn to their own collected weather and biodiversity data. They graph, analyze, and interpret patterns to reach conclusions about how their local weather affects their neighborhood plants and animals. All lesson plans, printables, prese
Subjects:
Grades:
PreK - 6th
Types:
NGSS:
K-ESS2-1
, 2-LS4-1
, K-LS1-1
, K-ESS3-3
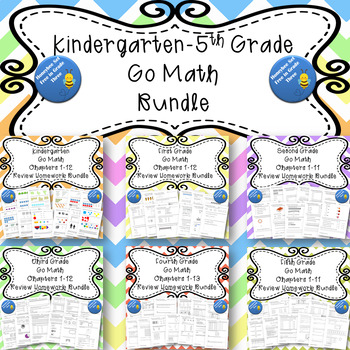
Kindergarten-Fifth Grade Go Math Chapter Review Homework BUNDLE
This is a bundle for ALL Kindergarten-5th Grade Go Math! chapter resources I have created. These math reviews are correlated to the Go Math! series. This bundle is geared towards those that teach math to multiple grade levels, switch grade levels frequently, or need to differentiate math due to various student math levels. This bundle includes reviews for all elementary grades Kindergarten-5th grade. Each review can be used as a homework assignment, an in class review, another form of the chapte
Subjects:
Grades:
K - 5th
Types:
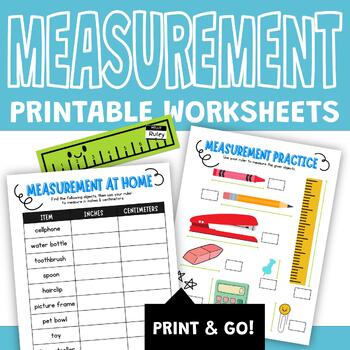
Math Measurement Activities (Centimeters & Inches) Printable Worksheets
No Fuss - Print & Go - Fun & Engaging! Use these worksheet activities to supplement your measurement unit. You can use these in math centers, group work, or as homework! ***TEACHER TIP: USE MY PRINTABLE RULERS --> CLICK HERECheck out my other Math Activities:Fast Food Menu MathWriting Money Worksheet
Subjects:
Grades:
1st - 5th
Types:
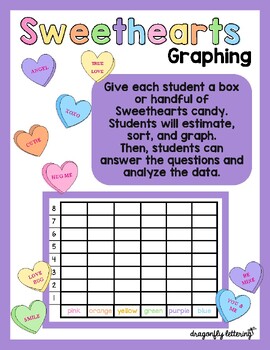
Sweethearts Candy Graph - Bar Graph, Line Plot, Picture Graph, Estimations
Estimating and Graphing Sweethearts CandyThis is a great Valentine's Day activity!Give each student a box or cupful of Sweethearts Candy to sort, graph, and analyze the data.Use these No PREP templates to create an academic-focused Valentine's Day project!Students will love that it involves candy and you will love that it involves math!This file includes:Estimations/Results Worksheet 4 graphing templates - differentiated questioning - one geared towards younger grades and one geared towards olde
Subjects:
Grades:
PreK - 8th
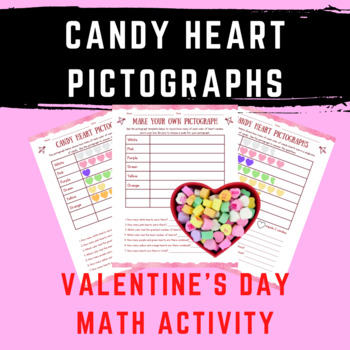
Candy Hearts Pictographs: Valentine's Day Math Activity
This product includes 3 different candy heart pictograph worksheets at 3 different levels of understanding so that you can provide your students with differentiated activities. Students will have a blast working individually, in partners, or in small groups to to complete these candy heart pictograph worksheets. The 3 levels include:Level 1: Interpreting pictographs with a scale of 1Level 2: Interpreting pictographs with a scale of 2Level 3: Make your own pictograph and select your own scale
Subjects:
Grades:
2nd - 4th
Types:
Also included in: 3rd Grade Valentine's Day Math and Coloring Activity Bundle
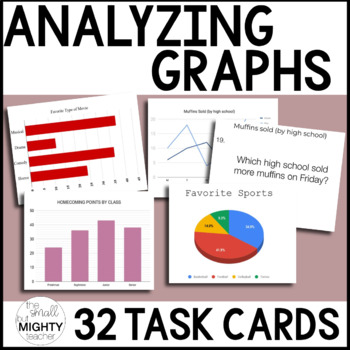
Analyze Graphs Task Cards (mixed graph types)
Analyze and interpret bar graphs with these engaging task cards! Students will read graphs and answer comprehension questions about them. Print and go with this easy to use resource!This printable includes total task cards that relate to reading and interpreting graphs- mixed, bar and line graphs. Each graph has 8 questions that relate to it, and task cards are clearly labeled for what graph they go to, for 32 total task cards. This activity includes:4 graph task cards32 question task cards answ
Subjects:
Grades:
3rd - 5th
Types:
CCSS:
Also included in: Analyzing Graph BUNDLE (bar, line and circle graph)
Graphing without Numbers - STEM
Title: Graphing Without Numbers: LUNAR STATION Theme / Topic: Graphs & Coordinate PlanesEssential Question: What do the marks on a graph represent? How can I use data to make decisions?Recommended Level: K-5Purpose: To introduce the concept of data-driven decision-making through graphs and charts.
Subjects:
Grades:
K - 5th
Types:
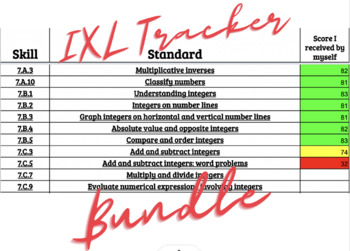
3rd-8th Grade IXL Math Digitial Trackers
Do you teach only one grade but have a classroom full of students who academically perform on different grade levels? Do you want to make sure you target the multiple skills each of those students need?Purchase the bundle and assign (via Google Classroom) a document to each student based on their performance level! It's as simple as that!Students will become independent and strong mathematicians. SIt back and watch them grow!
Subjects:
Grades:
3rd - 8th
Types:
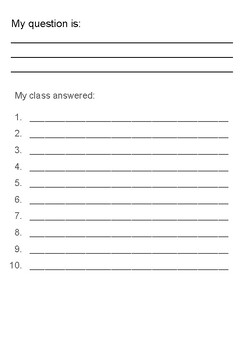
Graphing From a Survey Student Packet
This packet is helpful for students to walk through the entire process of creating a question, surveying their class to collect data, turning that data into a table, taking that table and creating the appropriate graph, and then answering questions based on the graph. I usually give my 2nd grade class a few days to complete the entire activity taking a day for each page while a 4th grade class could to it in 2 days. With the younger ones I usually give a sentence starter for their question, "Do
Subjects:
Grades:
2nd - 4th
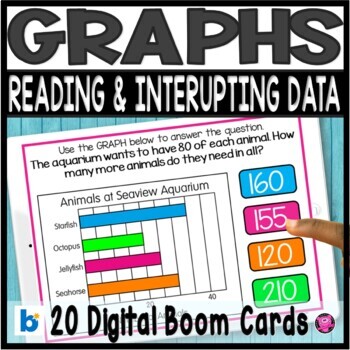
Reading and Interpreting Graphs DIGITAL Task Cards | Graphing
Do your students need teaching and practice activities for reading and interpreting horizontal and vertical bar graphs? This is a set of 20 DIGITAL Boom task cards for students to practice reading and interpreting HORIZONTAL and VERTICAL bar graphs with increments of 5. Students will answer questions like: "how many more", "how many less", and "compare data" about Aquarium Animals. Great for math centers/stations, whole group teaching, small groups, and even assessments! Boom Card can be used wi
Subjects:
Grades:
1st - 4th
Types:
Also included in: Graphing and Date Analysis Reading and Interpreting Graphs and Data
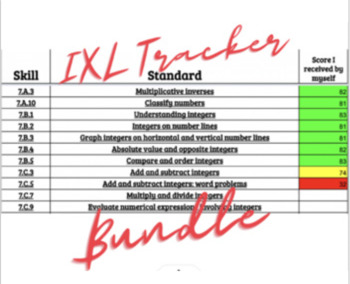
Elementary (3-5) Grade IXL Math Digitial Trackers
Do you teach only one grade but have a classroom full of students who academically perform on different grade levels? Do you want to make sure you target the multiple skills each of those students need?Purchase the bundle and assign (via Google Classroom) a document to each student based on their performance level! It's as simple as that!Students will become independent and strong mathematicians. SIt back and watch them grow!
Subjects:
Grades:
3rd - 5th
Types:
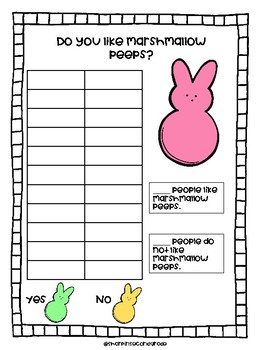
Easter Data Pack - Jelly Beans and Peeps
Looking for an engaging activity that requires food?In this file you will get:- A marshmallow peeps data chart (Tally Chart)- A jelly bean tally chart- A question page for students to use with their jelly bean chart- A jelly bean bar graph***For extra fun: Fill plastic eggs with the jelly beans and hide them around your classroom. Students can HUNT around the room and collect an egg to use for their data!***
Subjects:
Grades:
1st - 4th
Types:
Also included in: Data Bundle 2nd Grade
STEM Forces & Motion (3rd-5th) grade Energy Bounce DRIVING STEM
ENERGY BOUNCEStudents are challenged to investigate potential and kinetic energy as they look for patterns in the way a ball bounces. Collect data. Analyze data. Make decisions using data. ESSENTIAL QUESTIONS1. What is the difference in kinetic and potential energy?2. What are some examples of energy transversions?Potential energy is energy that is stored in an object. If you stretch a rubber band, you will give it potential energy. As the rubber band is released, potential energy is changed to
Grades:
2nd - 5th
Types:
NGSS:
K-2-ETS1-2
, K-2-ETS1-3
, K-2-ETS1-1
, 3-5-ETS1-3
, 4-PS3-3
...
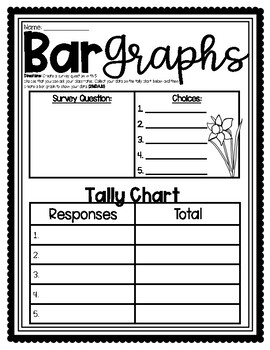
(((3 PAGES))) Bar Graph Activity & Worksheet
Bar Graph Activity & WorksheetStudents create their own survey, gather data and make their own bar graph! Thank you for purchasing! Your feedback is greatly appreciated. :)For more products like this one, visit Kendra's Kreations in 2nd Grade!
Subjects:
Grades:
1st - 6th
CCSS:
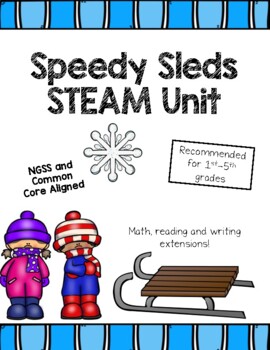
Speedy Sleds STEAM Unit
Anyone else feel like the month of January never ends? I am always looking for ways to keep my students engaged in learning and having fun, and this sled challenge is a perfect way to keep students busy. This challenge has so many interdisciplinary connections and is one of my absolute favorite STEAM lessons. I love that it gets at the heart of science; testing, gathering data, and drawing conclusions rather than students competing to create the "best" design.Included in this download:Suggested
Subjects:
Grades:
2nd - 4th
Types:
NGSS:
K-2-ETS1-3
, 2-PS1-2
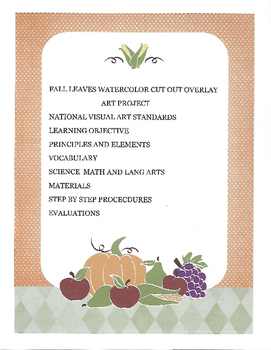
Leaves: A unit including, art, science, language arts, and science.....
This unit is based on the topic of leaves. It includes a detailed art lesson with
visual art standards, objectives, materials needed, vocabulary, step by step procedures to complete the art project and evaluations. To expand on the topic there is a vocabulary definition sheet, word search, and a crossword puzzle. Comprehension is covered with a fill in the blank activity, and an informational article on leaves with questions that are coordinated to the article paragraphs. Comprehension is furthe
Grades:
2nd - 4th
Types:
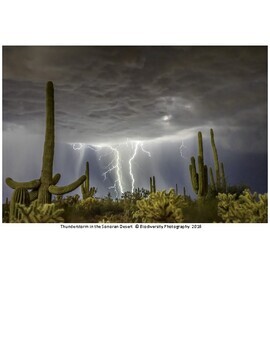
Weather Patterns - The Young Child Uses Their Own Data- STEM / STEAM Lesson 17
In this lesson, your students look for patterns revealed on their collected Daily Data sheets. First, they will use themselves as movable counting blocks to help think about how the weather affects their own behaviors. Then they analyze, graph, and interpret their accumulated Daily Data to reach logical conclusions about how changes in weather affect the local plants and animals in their schoolyard or backyard. Includes:Detailed Lesson PlanWeather & You Chart and QuestionsWhat Do You Wear C
Subjects:
Grades:
PreK - 6th
Types:
NGSS:
K-ESS2-1
, 3-ESS2-1
, K-LS1-1
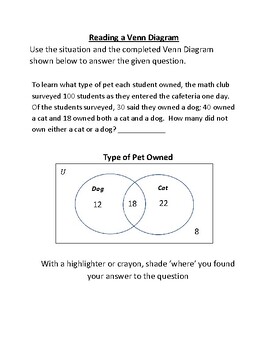
Two Simple Venn Diagrams
This "freebie" has two simple Venn Diagrams. The first Venn Diagram represents a given story problem; asking the student to highlight and/or coloring the answer to a specific question for this completed diagram. The second Venn Diagram has only one entry in a Venn Diagram from a given story problem. In order for the students to answer the three questions below the diagram, the students will need to complete the diagram. (Note: An answer sheet is provided.)
Subjects:
Grades:
4th - 12th, Adult Education
Types:
CCSS:
Showing 1-24 of 31 results


