20 results
3rd grade graphing resources for Easel $5-10
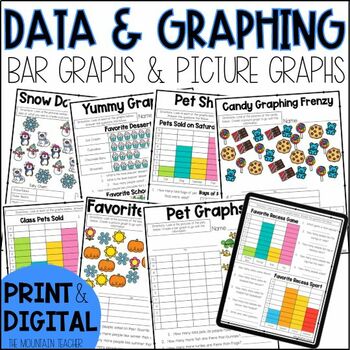
Bar Graphs and Picture Graphs Graphing Worksheets for 2nd Grade
Teach bar graphs and picture graphs to your 2nd or 3rd graders with ease using these graphing worksheets and assessments. This 3 week unit is filled with printable and digital graphing worksheets, assessments and activities covering various types of word problems about different graphs.Students will practice collecting data, graphing data on bar graphs and picture graphs and answering questions about the data using the graphs. Students will practice using graph keys on both picture graphs and ba
Subjects:
Grades:
1st - 3rd
Types:
CCSS:
Also included in: 2nd Grade Math Worksheets and Lessons YEAR BUNDLE Print and Digital
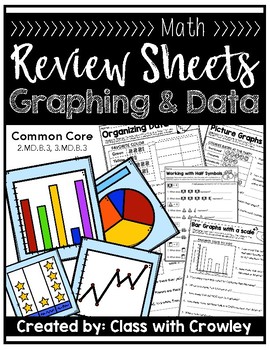
Graphing and Data (Review Sheets)
Easy... no prep... 37 Different review sheets to practice reading and interpreting graphing and data. Collecting data of your ownLabeling different tables, graphs and chartsFrequency Tables•Organizing data from a tally chart into a frequency table•Using a frequency table to answer one step questions•Using a frequency table to answer multi-step questions•Reading and interpreting multi-column frequency tablesPicture Graphs•Reading a picture graph w/no scale•Reading a picture graph w/ a scale•Using
Grades:
2nd - 4th
Types:
Second Grade Social Studies-Common Core Economics Unit
This is an economics unit for second grade that is aligned with Second Grade Common Core Social Studies Standard E.1.1-1.6. This unit includes almost everything you need to teach this standard. There are lesson plans for you, a student book, a study guide, a test, a take home project with a parent letter, a wallet and money and a classroom game. This is a 10 day unit.
Subjects:
Grades:
2nd - 3rd
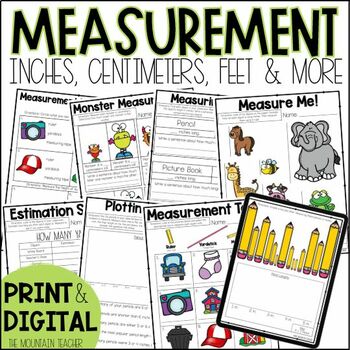
Measurement Worksheets, Anchor Charts & Assessments for 2nd Grade
Need some helpful measurement worksheets and anchor charts for your 2nd grade students? This 2 week unit is filled with printable and digital measurement worksheets, assessments and hands-on activities covering using a ruler, inches, centimeters, comparing lengths, length, width, height, estimating, line plots, selecting the correct tool, and more.What's Included in the Measurement Worksheets:23 Page Digital Workbook (9 Printable Worksheets PDF)Digital/Printable Pre and Post TestTeaching GuideAn
Subjects:
Grades:
1st - 3rd
Types:
Also included in: 2nd Grade Math Worksheets and Lessons YEAR BUNDLE Print and Digital
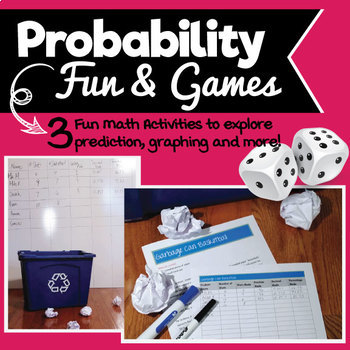
Probability Fun & Games! Exploring fractions, decimals, percentages & more!
Probability Fun & Games reinforces the concepts of: addition, prediction, graphing, fractions, decimals, and percents through three fun activities. Your students will be on the fast track to learning basic math skills. The packet include three activities - Roll Them Bones, Trash Can Basketball and What Color is Your Candy.
Included in this download are:
• Note to teacher with tips on using lessons
• Three activities with instructions
• Discussion prompts
• Ready-made charts for students to
Subjects:
Grades:
3rd - 8th
Types:
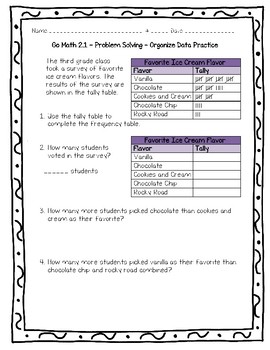
Go Math Practice - 3rd Grade Chapter 2 - Represent and Interpret Data
What's Included
Included in this pack are 9 worksheets on all the lessons in the Go Math book for chapter 2, a midchapter checkpoint practice sheet, and an end of the chapter checkpoint practice sheet.
I try to make each one 10 questions and on 1 page but due to the nature of this chapter (graphs and charts) there may be more or less.
These can be used as a quiz, formative assessment, homework, or just extra practice!
Answer keys are included for each worksheet.
Lesson 1: Problem Solving
Subjects:
Grades:
2nd - 4th
Types:
Also included in: Go Math Practice - 3rd Grade Worksheets For Entire Year Bundle
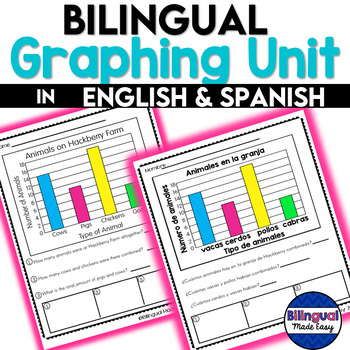
Graphing Worksheets in English & Spanish DIGITAL LEARNING
This Bilingual (English & Spanish) Graphing Unit for second and third grade students includes 10 different types of graphing worksheets.Each worksheet is available in black and white or in color for teachers to model. Each graph worksheet was created in English and has an identical worksheet in Spanish. This unit was designed to be used with English Language Learners in a Bilingual, English as a Second Language or Dual Language classroom. You no longer need to translate your worksheets or br
Subjects:
Grades:
2nd - 3rd
Types:
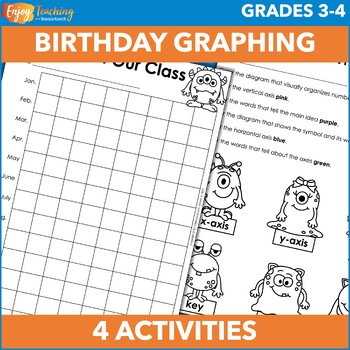
Birthday Pictograph, Bar Graph, Frequency Table & Line Plot Activities
Make graphing fun with birthdays! Together, kids create human and picture graphs. Then each child makes a bar chart. As a bonus, they can also crunch the data in frequency tables and display it on a line plot. Open the preview to take a closer look at the math activities.First, create a human graph. Ask kids to line up against a wall according to birth month. There’s only one catch: no talking! When you’re done, with a bird’s eye view, you’ve created a graph!Second, work together to build a pict
Subjects:
Grades:
3rd - 4th
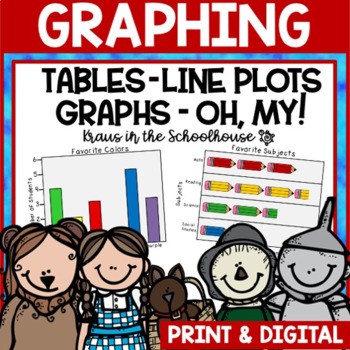
Graphing Activities and Worksheets | Easel Activity Distance Learning
Printable and TpT digital activities included for kids to practice their graphing skills. Students will learn about tally tables, frequency tables, picture graphs (pictographs), horizontal bar graphs, vertical bar graphs, line plots, circle graphs, and line graphs.This resource has a Easel Activity for distance learning already created for students to input their responses in answer boxes and to use other tools to draw and highlight. It is an Interactive layer over the original pdf. Click here
Grades:
2nd - 4th
Types:
Also included in: Math Activities Bundle
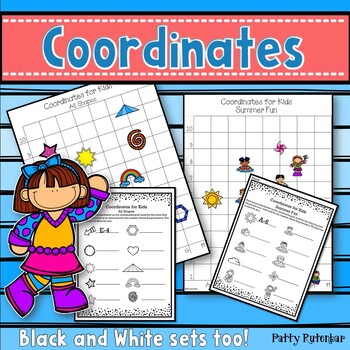
Coordinates for Kids Quick and Easy (Color and BW)
Coordinates are a set of values that show an exact position. The pictures are placed on a point on the chart. Students will line up the point between the horizontal and vertical lines to see where specifically where the picture is sitting.This set of 12 different maps or charts will help your young students find the exact position of the pictures. They will use coordinate skills to locate and identify the location. This set was updated in July 2022. It now includes a black and white version of
Subjects:
Grades:
1st - 3rd
Types:
CCSS:
Third Grade Common Core Math 3.MD.3-4 Graphs and Data / Measurement
This is a ten day unit and covers 3.MD. 3 and 4. The first part of the unit covers 3.MD.3. Students will learn to create a scaled picture graph and a scaled bar graph. Later students will solve 2 step word problems using the information represented in the graph. The second part of the unit teaches 3.MD.4. In this part of the unit, students will generate measurement data by measuring lengths using rulers marked with halves and quarters of an inch. Students will use this data to create a li
Subjects:
Grades:
3rd
Types:
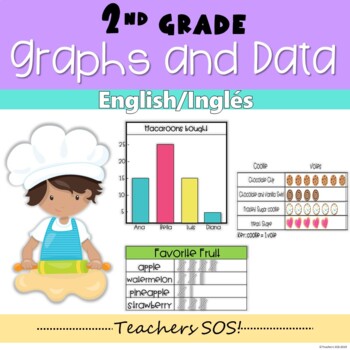
Graphs and Data; Bar Graph, Tally Charts, Picture Graph, Line Plot Worksheets
Hey teachers, here is a set of worksheets and activities that work with different graphs; picture graphs, bar graphs, tally charts, and line plots. Each graph has at least 4 categories and all of them include their own set of questions for students to answer using the information presented in the graph. This document is divided by sections (posters, activities, worksheets COLOR, worksheets B&W, answer key) that are hyperlinked in the table of content for easy access. A "How to Use" page is a
Subjects:
Grades:
2nd - 3rd
Types:
CCSS:
Also included in: BUNDLE Place Value , Telling Time, Money, Graphs and Data 2nd Grade
GRAPH WORKSHEET NO PREP PRINTABLE PACK COMMON CORE MAFS ENVISION
GRAPH WORKSHEET NO PREP PRINTABLE PACK COMMON CORE MAFS ENVISION
This is a “differentiated” worksheets pack for graphing and data collection. Can be used as a stand-alone a mini unit for guided/independent practice. It is an important skill that students learn how to read, interpret and create their own graphs. This graphing packet is perfect for to help students to learn these skills. This pack covers skills ranges from early first to second grade and can be used for review and enrichment. I
Subjects:
Grades:
K - 3rd
Types:
Also included in: GRAPH BUNDLE WORKSHEETS MATS ASSESSMENTS COMMON CORE MAFS ENVISION
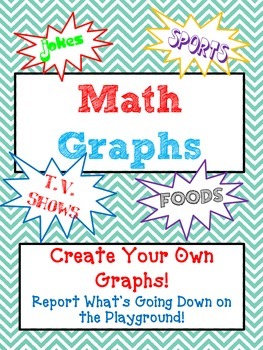
Bar Graphs, Line Graphs, and Pictographs- Distance Learning
Bar Graphs , Line Graphs , and PictographsOver 20 fun and creative graphing lessons, complete with graphing samples, Common Core questions, pictograph symbols etc.Included:Lesson for Bar GraphLesson for Line GraphLesson for PictographEach lesson includes:-Graphing Criteria Chart-Graphing Ideas page for teacher-Tally Chart and an example Tally Chart-Graph worksheet-Graph Sample-Graphing Vocabulary Worksheet-Graphing Questions
Grades:
3rd - 5th
Types:

Alphabet Color by Number Addition and Subtraction 100s Chart Math Activities
Students will love practicing addition and subtraction on a 100s chart this year with 26 highly engaging alphabet mystery pictures. These color by number activities are a creative way to practice adding and subtracting, they can be completed independently and are self-checking. Your students will love hunting for letters on a 100s chart with these fun color by number math activities.Twenty-six no prep, print and go mystery letter activities invite students to answer a series of addition and answ
Subjects:
Grades:
2nd - 3rd
Types:
CCSS:
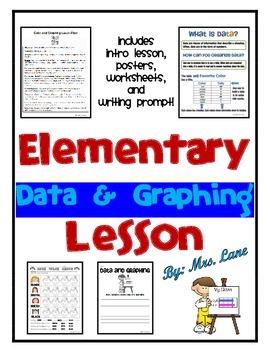
Elementary Data and Graphing Lesson
Are you looking for a basic data and graphing intro lesson? Look no further! Save your valuable time because you found it!
------------------------------------------------------------------------------------------------
*THIS PRODUCT INCLUDES:
-Intro Lesson (1)
-Posters (3) : What is data? How can you organize data?, How can a graph be used to represent data? Pictograph, Bar Graph, Circle or Pie Graph, and Line Graph
-Worksheets (3) Hair Color Graph, Eye Color Graph, and Help me make a gr
Subjects:
Grades:
2nd - 4th
Types:

Campers Wanted End of Year Math Fun
Campers Wanted End of Year Math Fun
Packet includes area/perimeter map skills
money skills review
time skills
two digit addition
picture graph
create a bar graph
analyze a bar graph
Black-line version added
Answer key
Subjects:
Grades:
2nd - 3rd
Types:
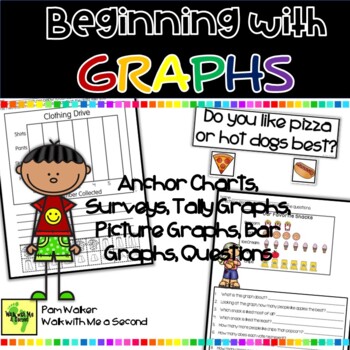
Graphing for Beginners | Tally Marks Picture Graphs Bar Graphs
This resource is designed for introducing graphing and offering a variety of practice tasks for primary learners. Here you get a beginning focus on tally graphs, picture graphs, and bar graphs for primary learners, saving line and circle graphs for older students. Since much of what is offered in media comes in the format of visuals, including graphs, we need to teach students how to interpret and analyze what the graphs or other visuals are trying to convey or not convey. This pack will make yo
Subjects:
Grades:
1st - 3rd
Types:
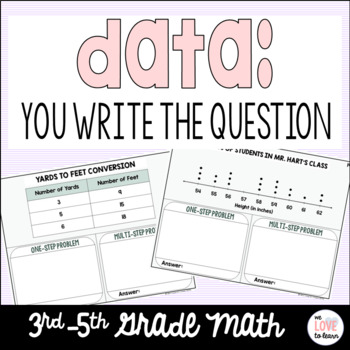
Digital Data Activity: You Write the Question for Google Slides
Looking for a fun, new way for students to interact and better understand data? By having the students write the question, this no-prep, digital activity will challenge students to not just look at the graph to answer the question in front of them, but will encourage them slow down and spend time analyzing the graph to be able to write a one-step and two-step problem. What's Included:Two formats included - PDF and Google Slides30 graphs for students to write word problemsColor Set and Black and
Grades:
3rd - 5th
Types:
Also included in: BUNDLE: 4 Year-Long Math Station Activities
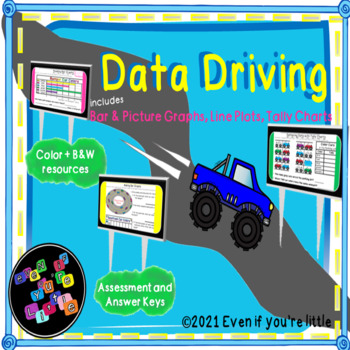
Data Driving with tally charts, bar graphs, picture graphs, line plots
Enjoy a drive through the land of data and graphing with= DATA DRIVING!Resource includes printables for work with tally charts, picture graphs and pictographs, bar graphs, line plots, and a cumulative assessment for lower elementary. No scaled values. Pages include answer keys for each. (excluding student Create-Your-Own page as answers will vary)Resources provided in color and black&white. Resource Assignments included:-Gathering Data with Tally Charts-Reading Picture Graphs-Using Picture G
Subjects:
Grades:
1st - 3rd
Types:
Showing 1-20 of 20 results


