13 results
End of Year graphing classroom decor interactive whiteboards
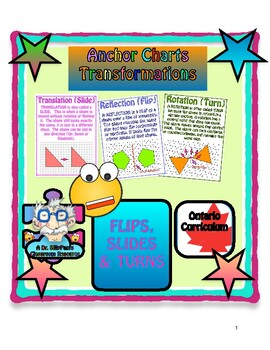
Anchor Charts: Transformations - Flips, Slides and Turns, Geometry/Spatial Sense
Anchor Charts Based on transformations (Flips, Slides & Turns) to be displayed in the classroom. Can also be displayed via SmartBoard. Included:4 Anchor Charts!Definition and Example of Transformations Definition and Example of TranslationsDefinition and Example of Reflections Definition and Example of Rotations This resource is aligned with the 2005 Ontario Math Curriculum Document - Grades 3, 4, 5, & 6: Geometry and Spatial Sense. A Dr. SillyPants Classroom Resource. Can be paired with
Grades:
3rd - 6th
Also included in: A Bunch of Anchor Charts! Over 40 in All! + Bonus Game (Math)
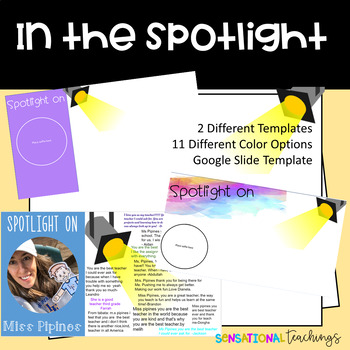
Student Spotlight Print & Digital
Whether you are distance learning or teaching in your classroom, this product is great to engage your students and spread positive vibes. Student Spotlight provides you with over 20 templates to choose from. You students are able to pass the spotlight poster around and write a positive memory or message to the student who is in the spotlight. .Includes:Digital Copy (Google Slides)11 different color options 2 different templates space to place your students' photoSuggested Uses Don't forget to
Grades:
PreK - 8th
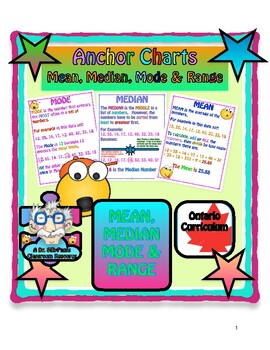
Anchor Charts: Mean, Median, Mode & Range - 6 in All! Data Management
Anchor Charts Based on Mean, Median, Mode & Range (Data Management) to be displayed in the classroom. Can also be displayed via SmartBoard. Included - 6 Anchor Charts:IntroductionModeMedianMedian 2 MeanRange This resource is aligned with the 2005 Ontario Math Curriculum Document - Grades 3, 4, 5 & 6: Data Management & Probability. A Dr. SillyPants Classroom Resource. Can be paired with Math Moji Fractions Games! Do you have a subject or topic that you would like to have turned into a
Subjects:
Grades:
4th - 6th
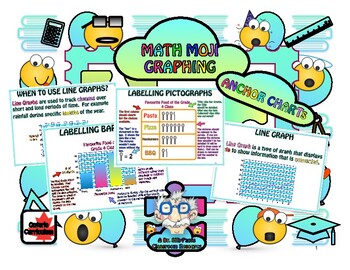
Anchor Charts: Everything Graphing! 14 in All! - Pie, Line, Picto & Bar Graphs,
Anchor Charts Based on Different Types of Graphs (Data Management) to be displayed in the classroom. Can also be displayed via SmartBoard. Included - 14 Anchor Charts:IntroductionCreating a SurveyExamples of Survey QuestionsTally ChartDifferent Types of Graphs Line Graphs When to use Line Graphs Labelling Line Graphs Bar Graphs Labelling Bar Graphs Pictographs Labelling Pictographs Pie Graphs Labelling Pie Graphs This resource is aligned with the 2005 Ontario Math Curriculum Document - Grades 3,
Subjects:
Grades:
3rd - 6th
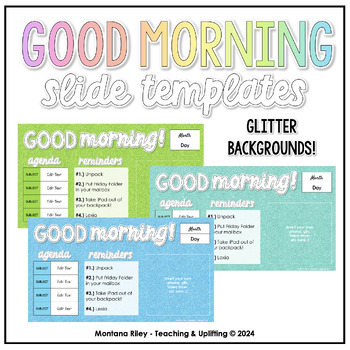
Good Morning Slide Templates - Glitter Backgrounds
These templates are perfect for putting up on your SmartBoard each morning as your students come into the classroom! There are 10 background options to choose from and you can edit the agenda items, reminders and date to your needs. Upload a fun GIF, a photo of your pet, class photos from the week onto the empty section to add something special to your slide! Tag me over on Instagram or TikTok @teachinganduplifting and I'd love to see how you're using this resource!Want unlimited access to any n
Subjects:
Grades:
PreK - 12th, Higher Education, Adult Education, Staff
Also included in: Good Morning Slides - Growing Bundle
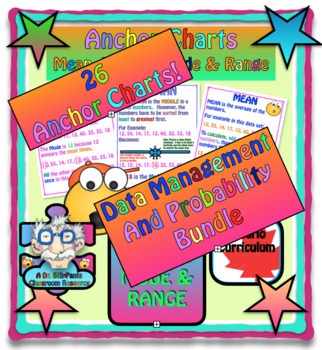
Anchor Charts! Entire Data Management & Probability. 26 in All! +Bonus Game
These Anchor Charts Based on the entire Data Management and Probability Unit can be displayed in the classroom or via the SmartBoard. 26 ANCHOR CHARTS! This resource is aligned with the 2005 Ontario Math Curriculum Document: Data Management & Probability - Grades 3, 4, 5, & 6.What's Included: Anchor Charts Everything Graphing - 14 Anchor Charts:IntroductionCreating a SurveyExamples of Survey QuestionsTally ChartDifferent Types of Graphs Line Graphs When to use Line Graphs Labelling Line
Subjects:
Grades:
3rd - 6th

St.Patrick's Day Math Activity
Teachers fill up ziplock bags of Lucky Charm cereal and distribute bags to small groups of students. Students count the total number of oats and different types of marshmallows. After adding up all of the totals, they find the rang, mean, median, and mode of their data set. They then collect the other groups data and analyze the whole class totals.
Subjects:
Grades:
5th - 7th
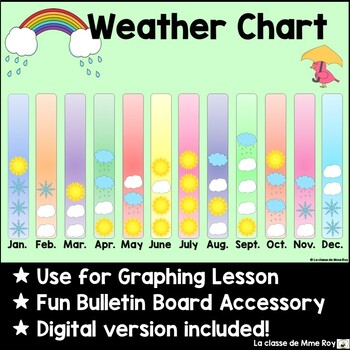
Weather Chart - Math Graphing - Bulletin Board (Digital Version included)
Here is a fun and colourful way to keep track of the weather with your students. You can print the different weather charts to make a bulletin board display or use the digital file included to track the weather on your classroom projected display (e.g. SMARTBoard). The weather charts can be printed as posters in whatever size you would like using the "Poster" printing option in Adobe.You can also print the charts for students to graph the weather individually by cutting and pasting the appropr
Grades:
K - 4th
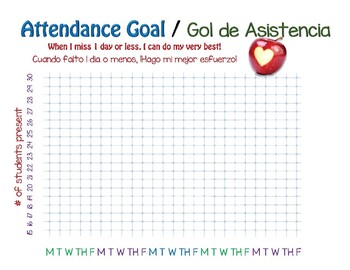
Classroom Attendance Poster Chart
This English/Spanish Attendance chart can be printed in poster size, or any size you might need to graph and chart your students daily and monthly attendance. Works great for morning meetings to help your students improve their classroom attendance.
Subjects:
Grades:
Not Grade Specific
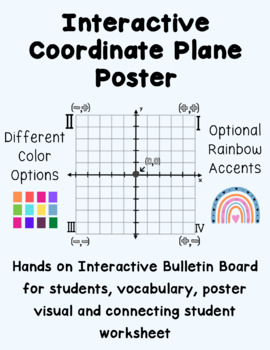
Interactive Coordinate Plane Poster
Hands on Interactive Bulletin Board for students, vocabulary, poster visual and connecting student worksheetUse these labeled points on the laminated graph as temporary points as an interactive bulletin board.Have students graph on following pages and label on chart each time the interactive graph is changed.Different Color OptionsOptional Rainbow Accents
Subjects:
Grades:
5th - 12th
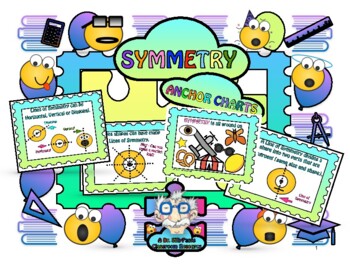
Anchor Charts: Symmetry - Geometry and Spatial Sense
Anchor Charts Based on Symmetry to be displayed in the classroom. Can also be displayed via SmartBoard. Included:4 Fun Emoji Style Anchor Charts!Introduction to Symmetry Line of Symmetry Horizontal, Vertical and Diagonal Lines of Symmetry Many Lines of Symmetry This resource is aligned with the 2005 Ontario Math Curriculum Document - Grades 3, 4 & 5: Geometry and Spatial Sense. A Dr. SillyPants Classroom Resource. Can be paired with Math Moji Fractions Games! Do you have a subject or topic t
Grades:
3rd - 5th
Also included in: A Bunch of Anchor Charts! Over 40 in All! + Bonus Game (Math)
Functions: Graphing Linear Inequalities (English & Español)
Graphing linear equations is something an elementary school teacher doesn't normally have to deal with. However, as this is part of an academic math progression, I felt the need to create this companion piece to this one.https://www.teacherspayteachers.com/Product/Expressions-and-Equations-Graphing-Linear-Equations-2964762Standards----------------------------------------------------------------------------------------------------------------CCSS.MATH.CONTENT.8.F.A.3Interpret the equation y = mx
Grades:
6th - 8th
CCSS:
Also included in: Bundle: Everything Elementary Math Anchor Charts (English & Español)
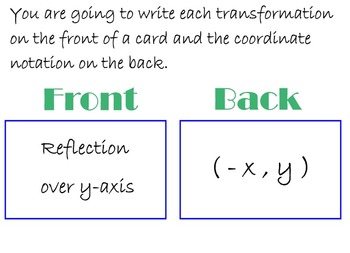
Transformations Flashcards
Students will create 8 flashcards for the "rules" of transformations. Directions, rules, and examples are included.
Grades:
8th - 10th
Showing 1-13 of 13 results


