16 results
Kindergarten graphing bulletin board ideas for Microsoft Word
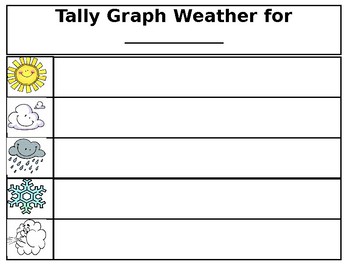
Tally Mark Monthly Weather Graph for Calendar
Tired of using the same weather graph for your calendar time? Look no further! I have included a monthly blank calendar graph using tally marks. You can copy a sheet for each student for their monthly calendar journals. Easy, small and clear for your students to use!
Subjects:
Grades:
PreK - 2nd
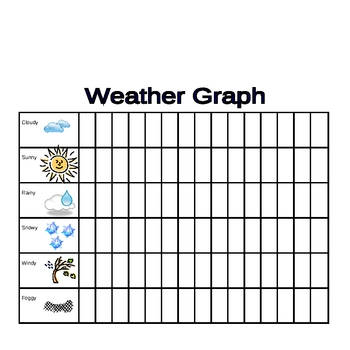
Weather Display / Graph / Pieces / Chart for Calendar w/ Sign Language
I made this weather set for my classroom calendar. I use it with Pre-K, but it is really more appropriate for first and second.
Set includes a display for the weather (I laminated), a chart to graph the monthly weather (I laminated; use wet erase marker to reuse monthly), 10 pieces** (hot, cold, cool, warm, sunny, cloudy, rainy, snowy, foggy, and windy), and a weather sign language chart
**Use Velcro dots to place pieces on and off display
Subjects:
Grades:
PreK - 5th
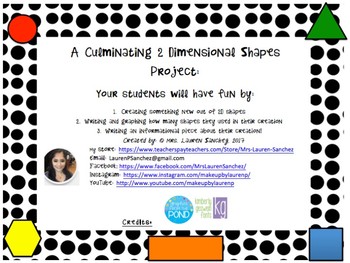
A Culminating 2D Shape Project
This is a fun and engaging way to end a unit on 2 Dimensional shapes. Your students will have the opportunity to create something using 2 D shapes, write how many of each shape they used, graph the amount, and then write an informational piece about what they created. Also included in this resource is an exit ticket which allows the students to show what they have learned about the 2 Dimensional shapes (square, circle, rectangle, triangle, and hexagon). The students are asked to identify how
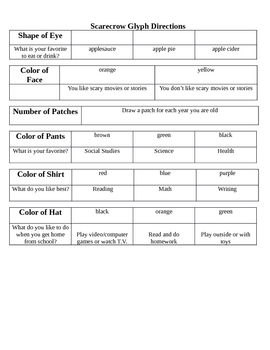
All about Me Scarecrow Glyph
Glyphs are a pictorial form of data collection that allows students to organize and analyze data.
Grades:
K - 6th
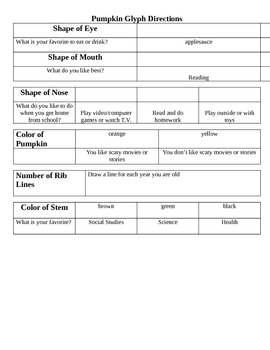
All about Me Pumpkin Glyph
Glyphs are a pictorial form of data collection that allows students to organize and analyze data.
Subjects:
Grades:
K - 6th
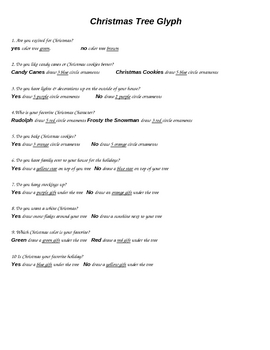
Christmas Time Tree Glyph
Glyphs are a pictorial form of data collection that allows students to organize and analyze data.
Subjects:
Grades:
K - 6th
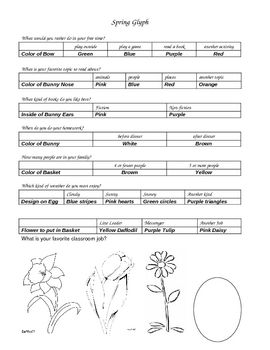
Spring Time Glyph
Glyphs are a pictorial form of data collection that allows students to organize and analyze data.
Grades:
K - 6th
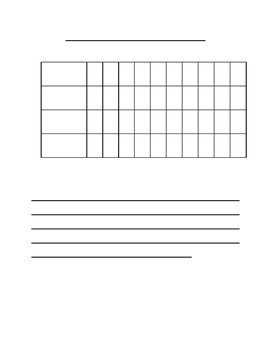
Graph Template
This is a blank template that students can use to create a graph for any category. I used this template in several ways (see the ideas included here). On the top line, students titled their graph. They labeled the axes and graphed the information. On the bottom lines, they wrote a paragraph describing/interpreting their results. One way I used this resource in my classroom was by graphing class information, such as favorite food. A second way was distributing something to students, such
Subjects:
Grades:
PreK - 5th

Counting Days of School using 10 Ten Frames - Number Chart to 200
4 Step Instructions: - Click on the bear you want to use- Select "Copy"- Click on the cell you want to place the bear- Select "Paste"If you know how to use Copy and Paste, you can use this fun Number Chart. It can be used for counting the days of school while using Zoom. Make sure to save the document as you make changes daily. Change the font size and/or color. Everything is editable.
Grades:
PreK - 3rd
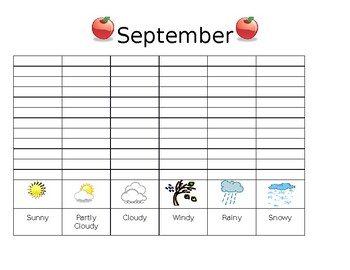
Weather Charts
Student helpers can chart the weather by coloring one space on the chart to make a bar graph. Display on morning meeting board and/or look for weather patterns.
Grades:
PreK - 4th
Types:

Our Class Lost Tooth Graph
This graph is in Word, so it can be easily altered. Change the names to the students in your class, print it, laminate it, then have the kids (or you) color in the boxes based on how many teeth they lost during the school year - or for their entire life! You don't have to laminate this to make it work.
Grades:
PreK - 4th
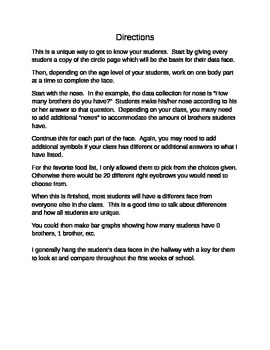
Data Collection Faces
This activity is a great "get to know you" or back to school activity. Likewise, it is academic in that it is collecting and sorting data at the same time you are getting to know the students. This activity can be adapted to be used from K to middle school grades.
Subjects:
Grades:
K - 8th
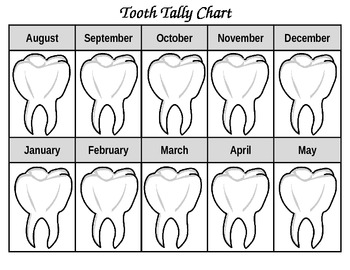
Tooth Tally
This is a document that helps the classroom teacher keep up with the student's who loose teeth. The pre-k, K, and 1st grade students enjoy graphing who is losing teeth. This is a great math activity that can be used for the entire school year. At the end of the school year, the data compiled can be used to make a bar graph, etc.
Subjects:
Grades:
PreK - 1st
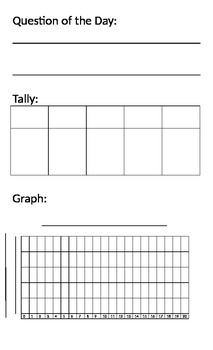
Daily Survey with Tally and Bar Graph French Version included
Laminate this to use everyday as an entry survey or during calendar time. Print on oversize paper to have the most room!
I hope you find this helpful in your classroom!
Grades:
K - 2nd

Birthday Graph with Western Graphics
Use as an activity or use a poster maker to enlarge for bulletin board.
Subjects:
Grades:
K - 2nd

Create a Bar Graph
Have students create their own bar graph! They can choose the title and labels of their choice.
Grades:
PreK - 2nd
Showing 1-16 of 16 results


