8 results
3rd grade for all subjects research for Microsoft Excel
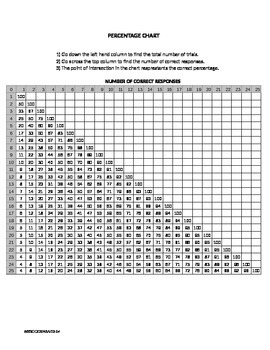
Percentage Chart ABA Monitor Number Of Trials, Correct Responses, and Percentage
Percentage Chart to Monitor Trials On Targeted Behavior Or Academic
This Percentage Chart allows a parent, teacher, or other service provider to monitor number of trials, number correct responses, and percentage correct on a targeted behavior or academic.
See Preview for chart!
Great for ABA!
Grades:
PreK - 7th

Instructional Strategies for Student Engagement Tool
This Instructional Strategies for Student Engagement Tool provides practical, research-based, instructional strategies all in one easy-to-use, sortable excel sheet. There are 131 strategies from fifteen different sources, classified into 9 functions. You can sort by Function/Purpose, Multiple Intelligence, Student Grouping, or Source. Also, by using the find/search command, you can target something specific you are looking for. Note: Keep the row height on "autofit" so that your rows will ad
Grades:
K - 12th
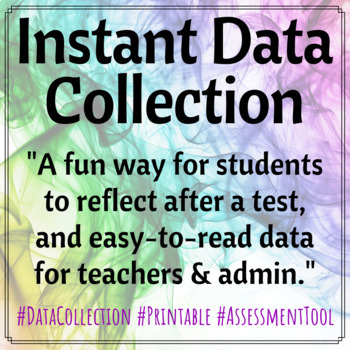
Instant Assessment Data Collection!
WORKS WITH ANY SUBJECT/CLASS !★ Distance Learning Adaptation (made to work with any Kahoot)THE GOALTo collect assessment data easily from students instead of analyzing each assessment yourself!QUICK OVERVIEWAnswer two questions and the program does the rest!How many questions on the assessment?Do you want numbered rows (for organization)?DIFFERENT USESCut out rows, distribute to students and have them mark which questions they got incorrect, collect, and tape in folder for quick dataUse 3-hole-p
Grades:
1st - 12th, Higher Education, Adult Education, Staff
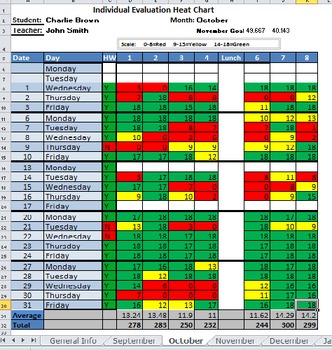
Student Behavior Heat Chart - Automatically adds colors!
The Student Behavior Heat Chart is meant to be accompanied by the Individual Classroom Evaluation form that can be downloaded from my store for free. The scores received in that form are to be added to this chart.
When scores are added to this chart, they are automatically assigned a color; red for poor, yellow for fair, and green for excellent. This allows you to get an overall snapshot of a student's behavior and easily see "problem periods" or behavior patterns.
The Heat Chart also takes
Grades:
1st - 8th
Types:

Student Course Evaluation Worksheet
Have your students evaluate the course and give you seom feedback.
Subjects:
Grades:
3rd - 12th, Higher Education, Adult Education
Types:
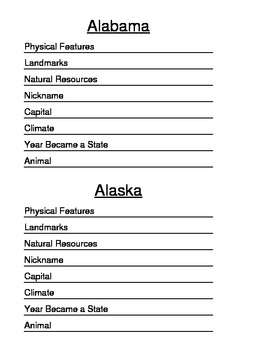
State Passport (Editable)
This is a printable book that the students can use to research information about all of the states. One way you could use this is to have different students research a state and share the information to the rest of the class. This way all of the students would have a complete book but only have to research a few states. Another way you could use this is to have the students research each state in a center and have the students slowly fill out their booklet.
Grades:
2nd - 6th
Types:
Assignment Grader with Statistics
This .xlsx spreadsheet automatically grades up to 25 questions for up to 100 students. Simply input the number of points earned, and the spreadsheet will total up the final score and provide descriptive statistics about your class performance! The tool will even provide feedback on each individual question to assess the fairness of questions. Statistics include:AverageMedianModeStandard Deviation# of Questions below 50% correctProvide meaningful insight into your student's performance with this
Subjects:
Grades:
PreK - 12th, Higher Education, Adult Education, Staff
Types:
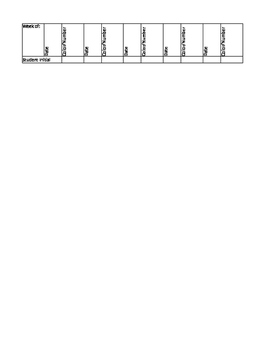
Sample Behavior Chart
This behavior chart was created for tracking daily behavior for a research project. Use it as a daily tracker for treasure box, IEPs, 504 plan trackers and parent communication.
Subjects:
Grades:
PreK - 5th
Types:
Showing 1-8 of 8 results


