15 results
Common Core 7.SP.A.1 research
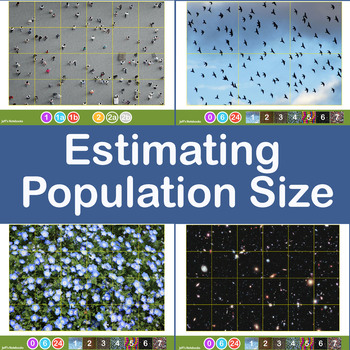
Estimating Crowd and Population Size using Jacob's Method
This investigation delves into estimating the size of a large population of objects by taking a sample and applying some basic mathematics. It encourages sharing of data, refining methods of collection of the data and discussion about the accuracy and limitations of the method used.Jacob's Method of counting large numbers of objects is simple. Draw a grid dividing the area covered into equal size squares. Estimate (by counting) the population of one grid then multiply this by the number of squar
Subjects:
Grades:
6th - 11th, Higher Education, Adult Education
Pandemic Cross-Curricular Project (Coronavirus Distance Learning)
Items included in this resource (PDF and Editable):-Project Title Page-Table of Contents-PBL Letter from the CDC-Generic Overview of Project-Math Assignment (Crossed with Science)-Science Assignment (Crossed with Math, Social Studies, and ELA)-Social Studies Assignment (Cross with Math, Science, and ELA)-ELA (Crossed with Science and Social Studies)-Due Date Table (Rough and Final Drafts)-Help Session Table (Math, Science, Social Studies, ELA)-Rubrics (Math, Science, Social Studies, ELA)-Resourc
Subjects:
Grades:
5th - 9th
CCSS:
6 Editable Bar Graph Templates 2.0
Finally a simple and professional graph space that students can fill out without any design issues getting in the way. This file contains 6 ready-to-use graph options. Print them and have students fill them with pencil and ruler, or distribute them over computer and let them practice entering the data. Get a project perfect finish every time. Maybe you just want to fill it out live on a projector? The possibilities are endless! It's okay to say you love these bar graphs. So do we.Contains:- 2 bl
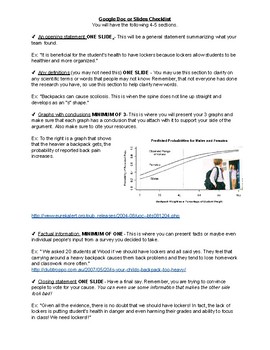
Statistics Debate Project
This is a final projects for students to do to end the statistic unit. It allows them to explore real life graphs and use them to build on their side of the argument. Students learn public speaking skills, powerpoint making skills, research skills, and how to read real like graphs.
Subjects:
Grades:
6th - 8th
Research Paper-integrating Math and Science
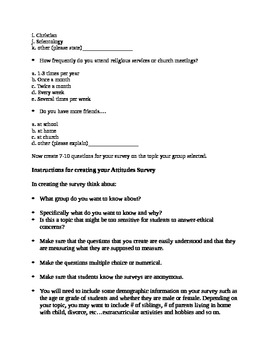
This is a research paper that breaks down the topic and methodology into sections. The project is student driven. Student groups decide on a reseach topic that they can actually research but also create a survey to administer to students in the school so that they are collecting their own data.
The booklet begins with students creating survey questions, but you may want to first have them do the intro to the paper and their hypotheses before creating the survey questions.
Science is integrate
Subjects:
Grades:
7th - 12th, Adult Education
Types:
Probability in the Real World Research Assignment
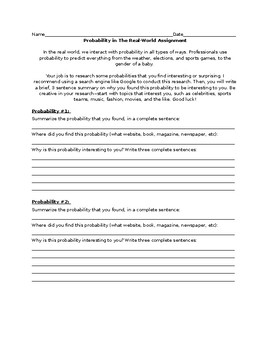
This product is a research assignment that is designed to get students engaged in probability. I like to assign this as homework during our introduction to probability week. Once students submit their homework assignment, I tape the summaries to the wall and have students do a gallery walk, analyzing their peer's research. It makes for a fun discussion and it garners buy-in from students who are hesitant to feel confident in math class. Fun probability applications you can recommend students res
Subjects:
Grades:
4th - 12th
Types:
World Travel Presentation: Geography, Economics, ELA Distance Learning Project
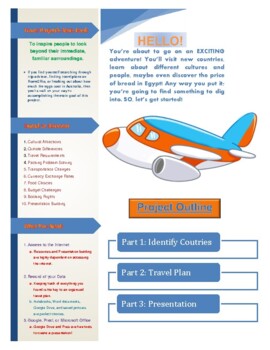
***PLEASE REVIEW THIS PRODUCT*** Are you ready for your biggest adventure yet?This product includes:Instructor and student guided lesson planTravel project outlineSpecific resourcesWebsite directional instructions Custom graphic organizer printable templatesPrezi account instructionsIntegrated subject learning: Geography, Economics, Mathematics, English, History, Technology, HealthDeep learning, real world considerationsBudgeting practice Creative writing story promptUse this product again and a
Subjects:
Grades:
4th - 12th
Types:
Budget Portfolio - Percents, Fractions, and Decimals
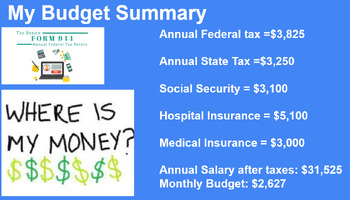
Step into the world of practical math with my meticulously crafted 'First Job Budget Portfolio Project' designed for 6th and 7th-grade classrooms. This engaging project seamlessly weaves percents, fractions, and decimals into the fabric of real-world decision-making. Students assume the role of a 22-year-old recent college graduate, celebrating their first job and embarking on the journey of creating a monthly budget based on their first annual salary. Aligned with specific 6th and 7th-grade Com
Subjects:
Grades:
6th - 7th
Types:
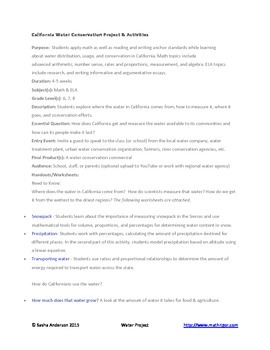
California Water Project
Students apply math as well as reading and writing anchor standards while learning about water distribution, usage, and conservation in California. Math topics include advanced arithmetic, number sense, rates and proportions, measurement, and algebra. ELA topics include research in addition to writing informative and argumentative essays. Sandra Kaplan's Depth and Complexity icons are identified.
Subjects:
Grades:
6th - 9th
Types:
Passion-Driven Statistics E-book (Introductory/AP Statistics Course Textbook)
Passion-Driven Statistics is an NSF-funded, multidisciplinary, project-based curriculum that supports students in conducting data-driven research, asking original questions, and communicating methods and results using the language of statistics. The curriculum supports students to work with existing data covering psychology, health, earth science, government, business, education, biology, ecology and more. From existing data, students are able to pose questions of personal interest and then use
Subjects:
Grades:
6th - 12th, Higher Education, Adult Education
Types:
SPSS software Secondary Data Analysis Workshop (Introductory/AP Statistics)
This handout is intended for those interested in teaching/learning basic introductory statistics concepts to analyze real data. Students will learn how to tell a story using secondary data analysis. The handout is for SPSS and the US Longitudinal Study of Adolescent Health data set. For handouts on the data set code book and raw data file, a PowerPoint to accompany the handout, or questions please email kristin.flaming@gmail.com or ldierker@wesleyan.edu.This handout was developed as a condensed
Subjects:
Grades:
6th - 12th, Higher Education, Adult Education
Types:
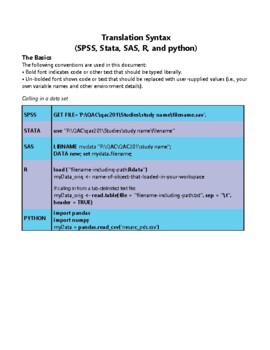
Translation Code
As part of our NSF-funded passion-driven statistics project, we have just started to share more widely our “translation code” aimed at supporting folks in learning code-based software and in moving more easily between them. The pdf includes all of the basic syntax for managing, displaying and analyzing data, translated across SAS, R, Python, Stata and SPSS. http://bit.ly/PDSTranslationCode.For more information about our warm and welcoming data-driven curriculum, check out https://passiondrivenst
Grades:
6th - 12th, Higher Education, Adult Education
Types:
STATA software Secondary Data Analysis
This handout is intended for those interested in teaching/learning basic introductory statistics concepts to analyze real data. Students will learn how to tell a story using secondary data analysis. The handout is for STATA software and the US Longitudinal Study of Adolescent Health data set. For handouts on setting up an account, the data set code book and raw data file, a PowerPoint to accompany the handout, or questions please email kristin.flaming@gmail.com or ldierker@wesleyan.edu.This
Grades:
6th - 12th, Higher Education, Adult Education
Types:
SAS software Secondary Data Analysis Workshop (Introductory/AP Statistics)
This handout is intended for those interested in teaching/learning basic introductory statistics concepts to analyze real data. Students will learn how to tell a story using secondary data analysis. The handout is for SAS (email for R, SPSS, Stata, & Python), a free cloud based system and the US Longitudinal Study of Adolescent Health data set. For handouts on setting up a free SAS account, the data set code book and raw data file, a PowerPoint to accompany the handout, or questions please e
Grades:
6th - 12th, Higher Education, Adult Education
Types:
R software Secondary Data Analysis Workshop (Introductory/AP Statistics)
This handout is intended for those interested in teaching/learning basic introductory statistics concepts to analyze real data. Students will learn how to tell a story using secondary data analysis. The handout is for R or R Studio, a free cloud based system and the US Longitudinal Study of Adolescent Health data set. For handouts on setting up a free R account, the data set code book and raw data file, a PowerPoint to accompany the handout, or questions please email kristin.flaming@gmail.com or
Subjects:
Grades:
6th - 12th, Higher Education, Adult Education
Types:
Showing 1-15 of 15 results

